Earnings performance at agricultural banks improved in 2025 alongside strong growth in farm loans. According to Reports of Condition and Income, farm loan balances at agricultural banks increased about 7% from the previous year and returns on average assets also rose notably. Strong loan growth and favorable loan yields boosted net interest margins, and bank liquidity tightened modestly. Delinquency rates increased slightly over the past year but remained low despite ongoing challenges for many crop producers.
The outlook for the U.S. agricultural economy remained subdued and uncertainty was heightened alongside recent volatility in commodity and fertilizer markets. Profit opportunities in the crop sector remained limited despite recent increases in crop prices as concerns surrounding a surge in fertilizer and fuel prices weighed on sentiment. Demand for lending grew and credit conditions tightened gradually alongside reduced working capital for crop producers over the past year. Despite persistent challenges, financial stress has remained limited with support from resilient farmland values, direct government assistance and strong cattle revenues in some regions.
Fourth Quarter 2025 Commercial Bank Call Report Data
Farm debt grew considerably at agricultural banks in 2025. Outstanding balances of non-real estate and real estate loans at agricultural banks increased about 9% and 6% from the previous year, respectively (Chart 1). Growth was more constrained at non-agricultural banks but picked up slightly compared with earlier in the year.
Chart 1: Farm Debt Outstanding at Commercial Banks
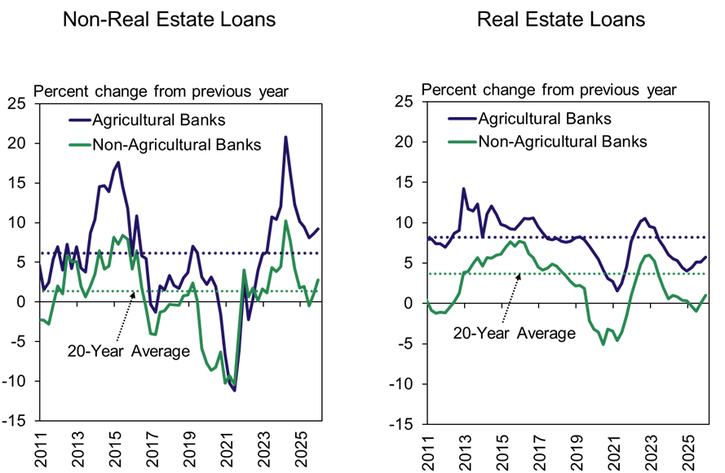
Note: Agricultural Banks are defined as banks with total agricultural loans comprising at least 25% of total loans. Figures above are calculated using the same group of 910 agricultural banks from Q4 2025 in every quarter.
Sources: Reports of Condition and Income and Federal Reserve Board of Governors
Farm loan delinquency rates increased slightly but remained low. Just over 1% of all agricultural loan balances were past due more than 30 days at the end of 2025 (Chart 2). About a quarter of all agricultural banks had a farm loan delinquency rate above 1% and half had negligible or no delinquent farm loans.
Chart 2: Farm Loan Delinquency Rates
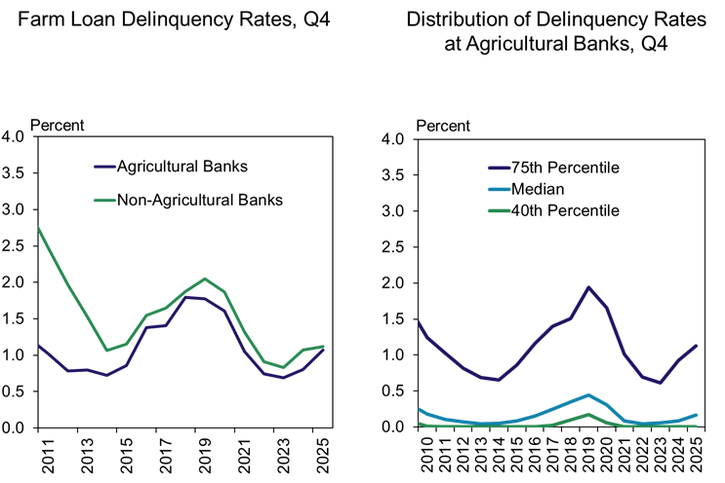
Note: Delinquent farm loans include all agricultural loans past due 30 or more days or non-accruing. Agricultural banks include all banks with farm loans comprising at least 25% of total loans.
Sources: Reports of Condition and Income and Federal Reserve Board of Governors
Liquidity at agricultural banks tightened modestly in 2025. The loan-to-deposit ratio among agricultural banks remained above the long-term average and increased slightly from the previous year to about 79% (Chart 3). While farm and non-farm loan balances continued to grow, deposits also increased steadily.
Chart 3: Liquidity at Agricultural Banks
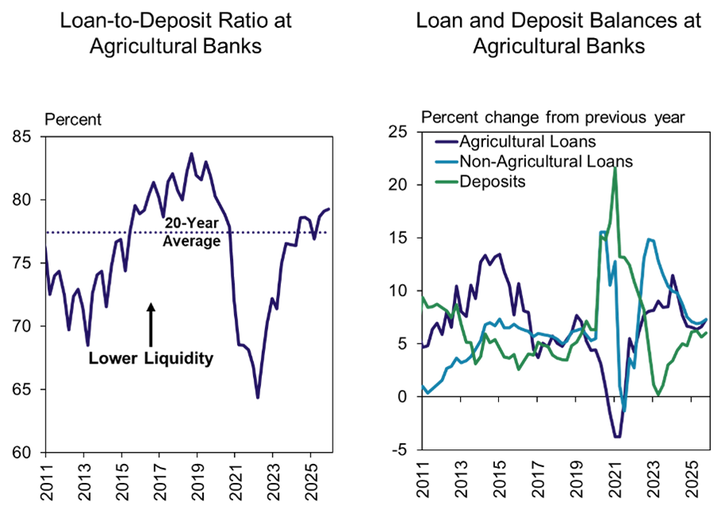
Note: Agricultural banks are defined as banks with total agricultural loans comprising at least 25% of total loans. Figures in the right panel are calculated using the same group of 910 agricultural banks from Q4 2025 in every quarter.
Sources: Reports of Condition and Income and Federal Reserve Board of Governors
Strong loan growth supported a notable improvement in financial performance at agricultural banks. The return on average assets among agricultural banks increased to the highest level during the fourth quarter since 2019 alongside a considerable rise in net interest margins (Chart 4). With strong returns, the Tier 1 Leverage Capital ratio also increased notably.
Chart 4: Earnings and Capital at Agricultural Banks, Q4
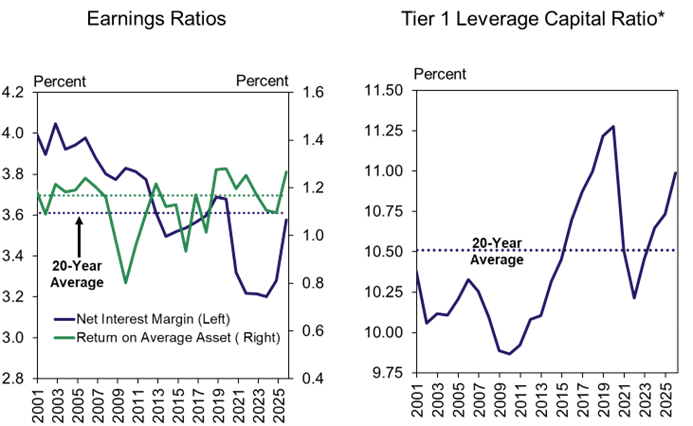
*This capital ratio excludes unrealized gains (losses) and is not reported in Ag Finance Update tables. Banks may elect to “opt-out” of including AOCI in the calculation of Tier 1 Leverage Capital utilized for regulatory purposes. However, these amounts are included in the calculation of the equity capital variable utilized in the Ag Finance Update – Commercial Bank Call Report data tables.
Note: Agricultural banks are defined as banks with total agricultural loans comprising at least 25% of total loans. Figures in the right panel are calculated using the same group of 910 agricultural banks from Q4 2025 in every quarter.
Sources: Reports of Condition and Income and Federal Reserve Board of Governors
Earnings performance was boosted by higher interest income and reduced interest expenses. Net income at agricultural banks increased by about 20% from the previous year (Chart 5). The increase was attributed to continued growth in interest income from loans and lower expenses on deposits that offset a steady rise in non-interest expenses that has been cited as a challenge for many smaller community banks.
Chart 5: Contribution to Change in Net Income at Agricultural Banks
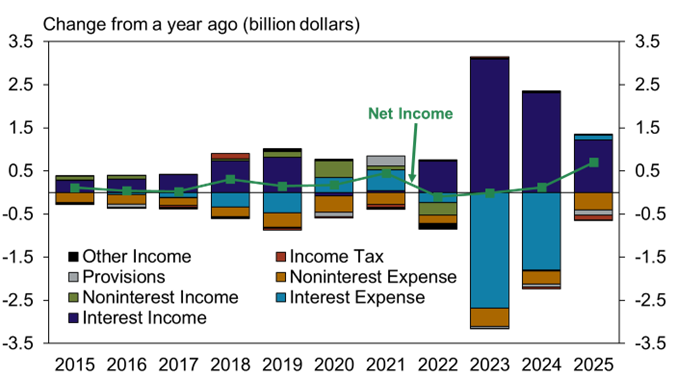
Note: Agricultural banks are defined as banks with total agricultural loans comprising at least 25% of total loans. Figures in the right panel are calculated using the same group of 910 agricultural banks from Q4 2025 in every quarter. A decline in an expense item is displayed as a positive contribution to net income and the sum of all items in each year equals the total change in net income.
Sources: Reports of Condition and Income and Federal Reserve Board of Governors
Commercial Bank Call Report Historical Data
Commercial Bank Call Report Data Tables
About Commercial Bank Call Report Data
The views expressed are those of the authors and do not necessarily reflect the positions of the Federal Reserve Bank of Kansas City or the Federal Reserve System.
Author
