The net interest margin, _ a measure of a bank’s profitability from core banking operations, has fluctuated in recent years as interest rates have changed. A number of factors, including balance sheet structure and the pace and size of interest rate movements, contribute to changes in a bank’s margin, which will be analyzed across recent rate cycles in the following pages.
The chart below shows changes in the net interest margin of community banking organizations _ (CBO) over the last three rate cycles: the rising rate environment of late 2015 to mid-2019; the decreasing/low-rate cycle of mid-2019 to early 2022, a large part of which was characterized by the COVID-19 pandemic; and the current rising rate environment. The red and blue bars in the graph reflect the negative or positive impact that changes in each of the net interest margin components – average earning assets, interest income on loans, interest income on other earning assets, and interest expense – had on margins, as represented by the purple bars (see Notes to Chart 1).
Chart 1. Drivers of Net Interest Margin Changes
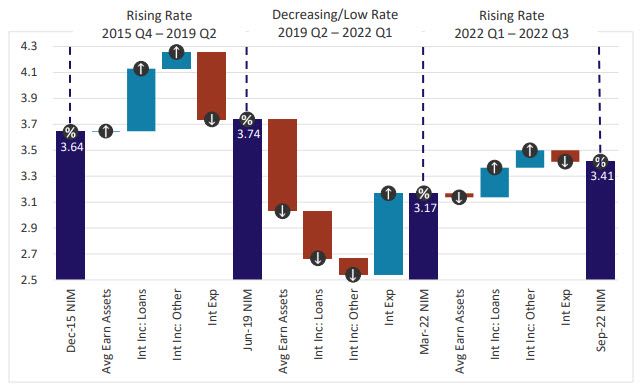
Notes: Drivers in red represent a hinderance to net interest margins, while drivers in light blue represent a benefit to net interest margins. For example, increases in interest expense and average earning assets are shown in red (hindrance to margin), while decreases are shown in light blue (benefit to margin).
Source: Reports of Condition and Income
RISING RATES: Q4 2015 – Q2 2019
Net interest margins responded as expected in a rising rate cycle beginning in late 2015. As shown in Chart 1, margins improved slightly across CBOs due to gains in interest income despite increased funding costs (shown as a hinderance to margins). Change in the level of earning assets (as the denominator of the net interest margin) did not have a meaningful impact.
LOW RATES: Q2 2019 – Q1 2022
During the decreasing and low-rate cycle of mid-2019 to early 2022, net interest margins declined to record lows in the midst of an economic environment largely influenced by the impacts of the COVID-19 pandemic on consumer behavior, business activity, and government response. Starting in early 2020, banks experienced significant influxes of deposits as government relief efforts, including consumer stimulus payments and funds for small businesses, flooded into banks. Banks found little opportunity to deploy these new funds at desirable yields, so instead placed deposits into liquid, yet lower-yielding assets, primarily cash and securities (see Chart 2). Loan growth was subdued with the exception of lower-yielding Paycheck Protection Program loans which, coupled with the already low-rate environment, weighed heavily on asset yields. In response, many banks extended the duration of investment portfolios to capture the greater yield from longer-dated securities and prevent further income erosion. In contrast, margins were able to benefit from reduced funding costs. At the onset of the pandemic, interest expenses were already relatively modest but with some room to decline. However, improvements in funding costs, as well as attempts to bolster asset yields through duration extension, were not enough to offset the impact of rapidly declining asset yields on margins.
Chart 2. Balance Sheet Trends and Fed Funds Rate
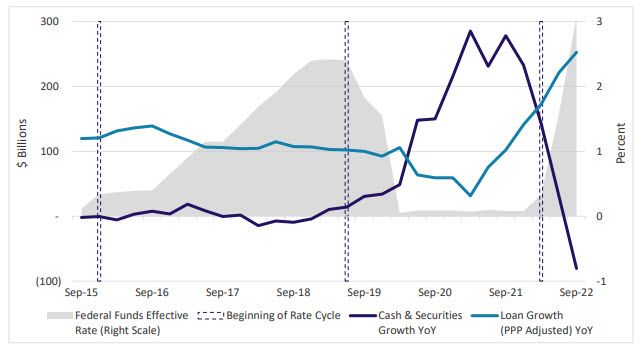
Note: Growth rates are adjusted for merger activity. Merger-adjusted calculations add the assets and liabilities of acquired institutions to the acquiring institutions in previous periods. The analysis treats acquired and acquiring institutions as if the merger had already occurred by the beginning of the period being analyzed. See: Breitenstein, Eric C., and Derek K. Thieme. 2019. "Merger-Adjusting Bank Data: A Primer." FDIC Quarterly, vol. 13, no. 1, pp. 31-49.
Source: Reports of Condition and Income, Federal Reserve Economic Data (FRED)
RISING RATES: Q1 2022 – PRESENT
Margins saw relief in mid-2022 with the reversal of many trends seen in the prior period. The Federal Open Market Committee (FOMC) increased its target for the federal funds rate five times between March and September 2022 for a total of 300 basis points (bps), benefiting bank asset yields. Initial concerns about loans remaining priced below contractual floors, even as rates rose, quickly went away due to the fast pace and magnitude of rate hikes. In addition, loan growth increased substantially to 9 percent over the two-quarter period, allowing banks to deploy excess liquidity into assets with more favorable yields (see Chart 2). Increased lending activity was funded by a transition from liquid, lower-yielding assets, which were shed from balance sheets (-13 percent over the same period), helping drive increases in asset yields and ultimately, interest income. Liquid assets were also used to fund deposit runoff and, as a result, total average earning assets remained stable during the period, providing relief to net interest margins. Compared to the significant gains in interest income, funding costs remained subdued, with only a slight uptick in interest expense._Banks historically lag deposit rate increases and may be demonstrating some willingness to let a portion of pandemic-induced deposits runoff before competing for funds at higher rates.
Looking ahead, margins will continue to be impacted by changing balance sheet structures and any future movements in rates. Given the speed and size of recent rate increases, deposit pricing can be expected to accelerate in late 2022 or 2023, despite lagging early in the rate cycle, if competitive pressure to raise deposit rates increases. Additionally, margins could be further impacted in 2023 should banks choose to look to alternative and more costly funding sources in response to deposit competition or runoff.
Questions or comments? Please contact KC.SRM.SRA.CommunityBankingBulletin@kc.frb.org
Endnotes
-
1 Net interest margin is calculated as net interest income (interest income less interest expense) divided by average earning assets.
-
2 Community banking organizations are defined as having $10 billion or less in total assets.
-
3 Deposit betas – a measure of how responsive deposit pricing is to changes in market rates – remained low during the period, even as rates rose aggressively
The views expressed are those of the authors and do not necessarily reflect the positions of the Federal Reserve Bank of Kansas City or the Federal Reserve System.
Author