Alongside strong growth in farm loans, liquidity at commercial agricultural banks tightened and earnings increased during the third quarter. According to Reports of Condition and Income, the average loan-to-deposit ratio at agricultural banks increased to the highest level since 2019 and rose comparably more at lenders with the highest concentration of farm loans. Liquidity declined alongside consistently strong growth in non-real estate farm debt, which also supported an increase in average net interest margins and return on assets. Demand for farm loans has grown steadily alongside softening in farm financial conditions and farm loan delinquency rates increased slightly from a year ago but remained relatively low.
The outlook for the U.S. farm economy remained subdued alongside weakness in the crop sector, but strength in the cattle sector has lifted conditions in some regions and recently announced government assistance will provide support to farm incomes. Disparities in the crop and cattle sectors have been evident in credit conditions but despite profitability challenges for crop producers, aggregate farm financial stress has remained limited. Ad hoc government payments associated with the American Relief Act and resilient farm real estate values have eased some strain in the sector throughout 2025. Looking ahead, market conditions in the crop sector are likely to keep profit opportunities narrow, but the recently announced Farmer Bridge Assistance Program will provide some relief to crop farmers in the coming months.
Third Quarter 2025 Commercial Bank Call Report Data
Growth in outstanding farm production loans at agricultural banks remained strong in the third quarter. Non-real estate debt among agricultural banks increased about 8 percent from a year ago and has grown at a pace above the 20-year average for more than two years (Chart 1). Growth in real estate debt at agricultural banks remained modest while both types of farm debt were nearly unchanged among non-agricultural lenders.
Chart 1: Farm Debt Outstanding at Commercial Banks
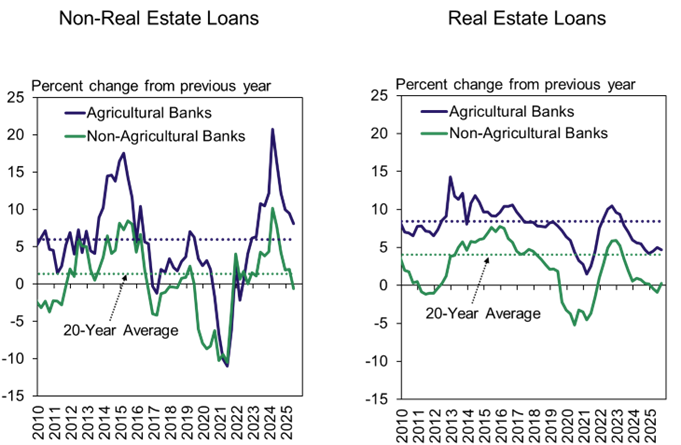
Note: Agricultural Banks are defined as banks with total agricultural loans comprising at least 25% of total loans. Figures above are calculated using the same group of 931 agricultural banks from Q3 2025 in every quarter.
Sources: Reports of Condition and Income and Federal Reserve Board of Governors
Liquidity at agricultural banks tightened further alongside consistently strong loan growth. Growth in both farm and non-farm loans at agricultural banks has outpaced or matched deposit growth for three consecutive years (Chart 2, left panel). Average loan-to-deposit ratios have historically been higher at highly concentrated agricultural banks where farm loans account for more than 300 percent of capital (Chart 2, red line in right panel), and increased notably to the highest level since 2019 for that cohort of lenders during the third quarter.
Chart 2: Liquidity at Agricultural Banks
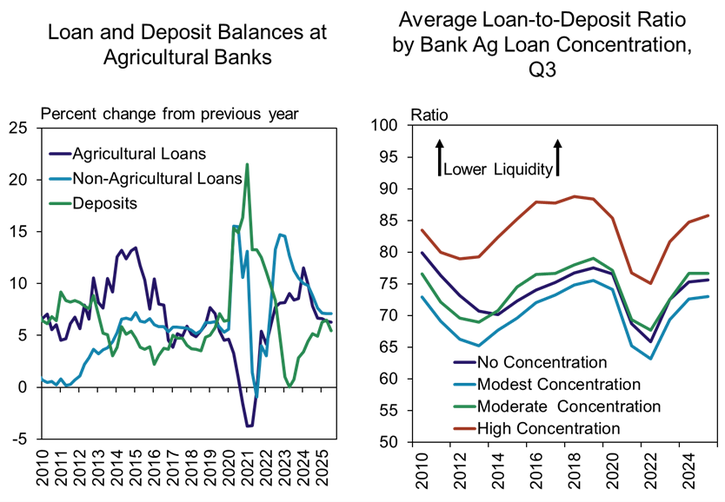
Notes: Agricultural Banks are defined as banks with total agricultural loans comprising at least 25% of total loans. Figures in the left panel are calculated using the same group of 931 agricultural banks from Q3 2025 in every quarter. Ag loan concentration is agricultural loans as a percent of Tier 1 Capital + Allowance for Loan Losses – No concentration=less than 100%, Modest concentration=100-200%, Moderate concentration= 200-300%, and High concentration= more than 300%.
Sources: Reports of Condition and Income and Federal Reserve Board of Governors
While liquidity tightened alongside strong loan growth, earnings performance at agricultural banks improved. Average net interest margins at agricultural banks also increased to the highest level since 2019 and supported an increase in average returns on assets (Chart 3). Interest margins also remained slightly higher at banks with the highest concentration of farm loans (red line).
Chart 3: Earnings Ratios by Bank Ag Loan Concentration, Q3
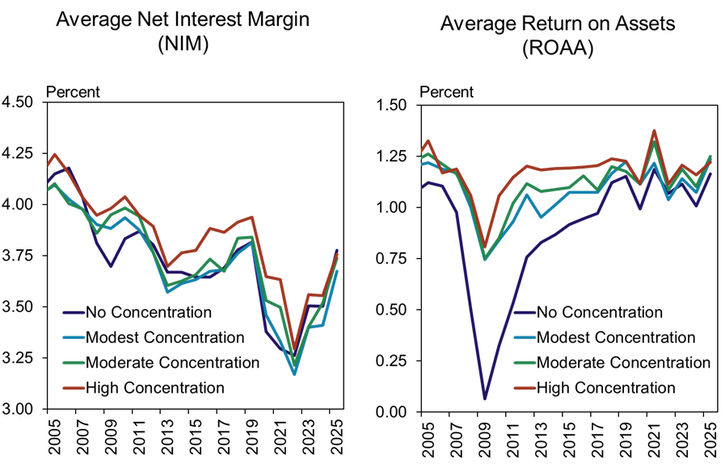
Note: Ag loan concentration is agricultural loans as a percent of Tier 1 Capital + Allowance for Loan Losses – No concentration=less than 100%, Modest concentration=100-200%, Moderate concentration= 200-300%, and High concentration= more than 300%.
Sources: Reports of Condition and Income and Federal Reserve Board of Governors
Farm loan delinquency rates increased alongside tighter farm financial conditions, but rose less for the most highly concentrated agricultural banks. The average delinquency rate on farm loans at banks with high farm loan concentration remained less than 1 percent and increased to only about 1.25 percent for all others (Chart 4, left panel). With modest increases in delinquencies, average loan loss reserve ratios at agricultural banks were relatively steady (Chart 4, right panel).
Chart 4: Farm Loan Delinquencies and Loss Allowance by Bank Ag Loan Concentration, Q3
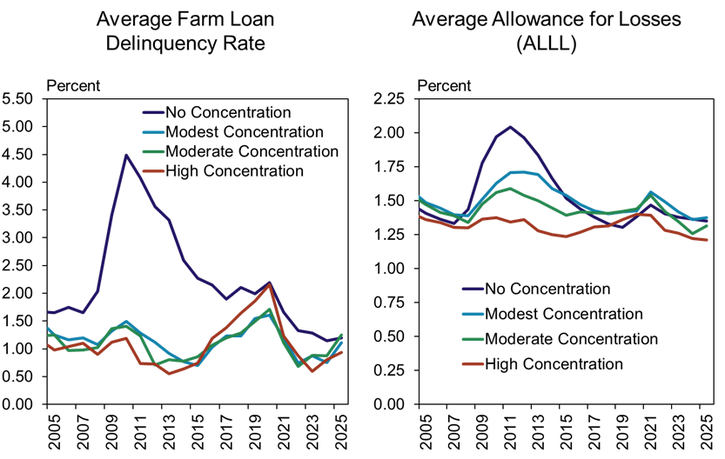
Notes: Delinquent farm loans include all agricultural loans past due 30 or more days or non-accruing. Ag loan concentration is agricultural loans as a percent of Tier 1 Capital + Allowance for Loan Losses – No concentration=less than 100%, Modest concentration=100-200%, Moderate concentration= 200-300%, and High concentration= more than 300%.
Sources: Reports of Condition and Income and Federal Reserve Board of Governors
Commercial Bank Call Report Historical Data
Commercial Bank Call Report Data Tables
About Commercial Bank Call Report Data
The views expressed are those of the authors and do not necessarily reflect the positions of the Federal Reserve Bank of Kansas City or the Federal Reserve System.
Author
