Large operating and livestock loans continued to drive strong growth in farm lending activity at commercial banks in the first quarter of 2026. According to the National Survey of Terms of Lending to Farmers, the volume of non-real estate loans for nearly all purposes was higher than a year ago. Operating and feeder livestock loan volumes grew alongside further growth in average loan sizes and accounted for most of the increase. Average farm loan interest rates were nearly unchanged from the previous quarter for the largest loans and declined slightly for smaller loans.
The outlook for the U.S. farm economy remained bifurcated, and uncertainty was heightened alongside recent volatility in commodity, energy and fertilizer markets. Weakness in the crop sector persisted as profit opportunities were limited and External Linka surge in fertilizer and fuel prices raised concerns about increased costs. Strength in the cattle sector continued to lift revenues in many areas, and recent distribution of payments from the Farmer Bridge Assistance (FBA) Program was expected to provide modest support to farm income and credit conditions. Despite ongoing challenges for many producers, farm real estate values remained resilient in recent months and provided support for the sector.
First Quarter National Survey of Terms of Lending to Farmers
Agricultural lending activity at commercial banks increased notably across most loan types. The volume of total non-real estate loans increased nearly 50% from the same time a year ago (Chart 1). Lending volumes increased notably for loans of all purposes except other livestock and growth was particularly notable for operating and feeder livestock loans.
Chart 1: Volume of Non-Real Estate Farm Loans
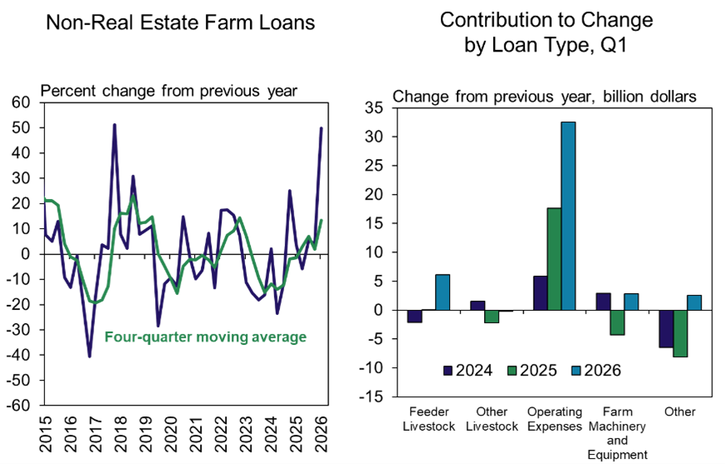
Sources: Survey of Terms of Lending to Farmers and Federal Reserve Bank of Kansas City
Operating loans grew alongside further increases in average loan sizes. The volume of lending comprised of loans greater than $500,000 increased substantially compared with a year ago (Chart 2). The share of new operating loans greater than $500,000 increased to a record high following steady increases in recent years.
Chart 2: Farm Operating Loans by Loan Size, Q1
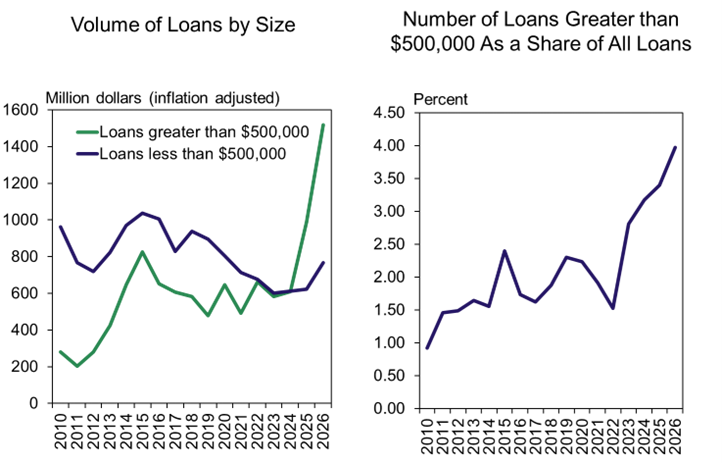
Sources: Survey of Terms of Lending to Farmers, and Federal Reserve Bank of Kansas City
Feeder livestock lending also increased alongside larger loan sizes that have grown with higher cattle prices. Following rapid growth in 2024 and 2025, the size and volume of feeder livestock loans increased at an average pace of about 15% and 25% over the past year, respectively (Chart 3). Loan sizes have grown rapidly as cattle prices reached record highs.
Chart 3: Cattle Prices and Feeder Livestock Lending
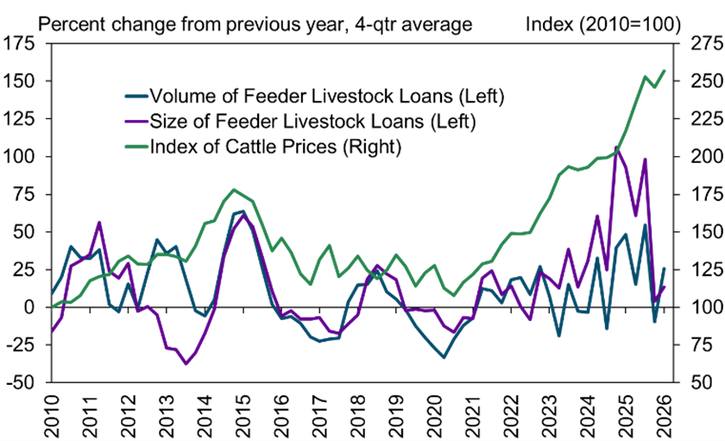
Sources: USDA, Survey of Terms of Lending to Farmers and Federal Reserve Bank of Kansas City
Farm loan interest rates remained above the recent historical average and changes from the previous quarter varied by loan size. The average rate on loans greater than $100,000 was nearly unchanged from the previous quarter (Chart 4). In contrast, average rates on loans of smaller sizes declined slightly.
Chart 4: Average Interest Rate on Non-Real Estate Farm Loans by Loan Size
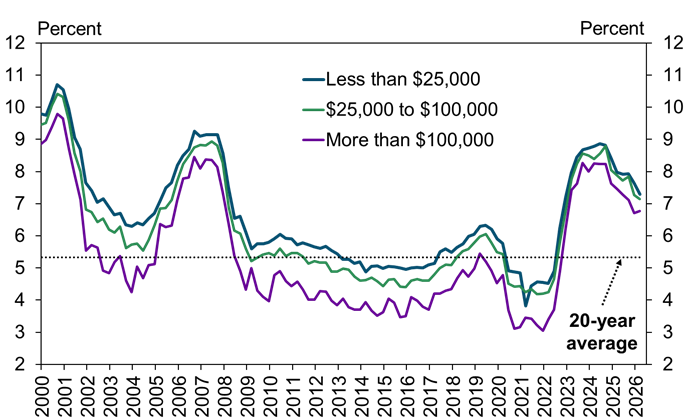
Sources: Survey of Terms of Lending to Farmers, and Federal Reserve Bank of Kansas City
National Survey of Terms of Lending to Farmers Historical Data
National Survey of Terms of Lending to Farmers Data Tables
About National Survey of Terms of Lending to Farmers Data
The views expressed are those of the authors and do not necessarily reflect the positions of the Federal Reserve Bank of Kansas City or the Federal Reserve System.
Author
