Farmland values in the Midwest and Plains states remained firm in 2025 despite steady deterioration in farm financial conditions. According to Federal Reserve Surveys of Agricultural Credit Conditions, farm income and credit conditions deteriorated gradually in the fourth quarter and farm loan interest rates declined slightly. Despite tighter farm finances, the value of cropland was unchanged or slightly higher than the previous year across all participating Districts. Resilient land valuations and distribution of ad hoc government assistance have supported the sector and financial stress remained limited through the end of 2025.
Fourth Quarter Federal Reserve District Ag Credit Surveys
Farm finances continued to weaken gradually in the fourth quarter. The pace of decline in farm income slowed slightly in some participating Districts, but deterioration remained steady (Chart 1). The share of lenders reporting farm income was lower than the same time a year ago was unchanged compared with recent quarters in the Kansas City District but declined in the Minneapolis and St. Louis regions.
Chart 1: Federal Reserve District Farm Income
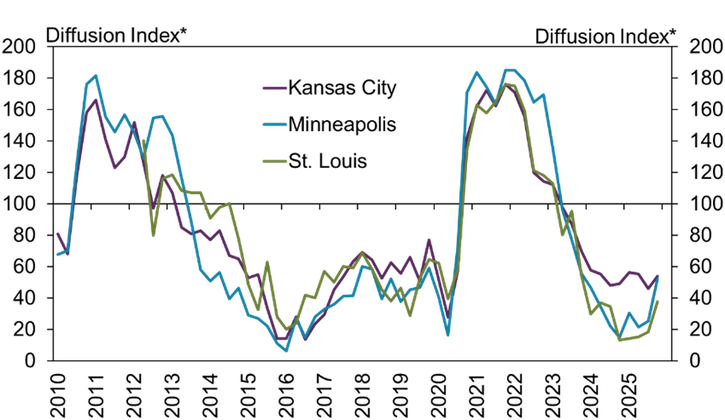
*Lenders responded by indicating whether conditions during the current quarter was higher than, lower than or the same as in the year-earlier period. The index numbers are computed by subtracting the percentage of survey respondents who responded "lower" from the percentage who responded "higher" and adding 100.
Note: Information about farm income and borrower spending is only collected for the above Districts. The St. Louis survey began in Q2 2012.
Source: Federal Reserve Surveys of Agricultural Credit Conditions
Softer farm finances continued to weigh on credit conditions, but deterioration was slower in many areas. The pace of decline in farm loan repayment rates was similar to recent quarters in the Dallas and Chicago Districts, but slowed in the Kansas City, Minneapolis and St. Louis regions (Chart 2). The share of lenders reporting that loan repayment was lower than the same time a year ago dropped considerably in many areas.
Chart 2: Federal Reserve District Farm Loan Repayment Rates
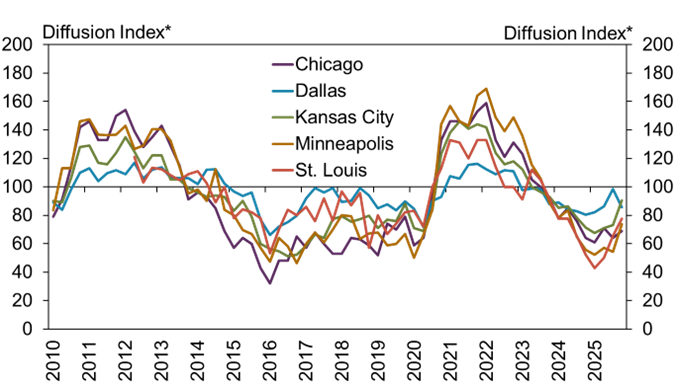
*Lenders responded by indicating whether conditions during the current quarter were higher than, lower than, or the same as in the year-earlier period. The index numbers are computed by subtracting the percentage of survey respondents who responded "lower" from the percentage who responded "higher" and adding 100.
Note: The St. Louis survey began in Q2 2012.
Source: Federal Reserve Surveys of Agricultural Credit Conditions
Interest rates on farm loans continued to decline from their 2023 peaks but remained higher than the 10-year average. Across participating Districts, average interest rates on all types of farm loans declined to around 7.5%, or about 100 basis points above the 10-year average (Chart 3). Average rates in the Chicago Fed region fell to around 6%, the lowest across Districts, while the Dallas District had rates that were the highest at just below 8%.
Chart 3: Average Farm Loan Interest Rates
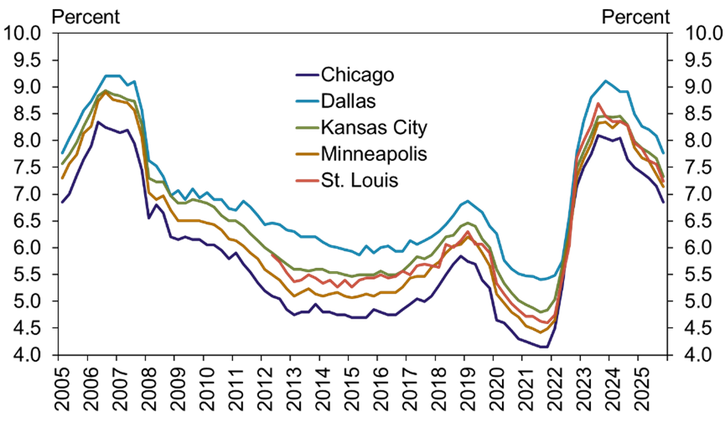
Notes: Average fixed rates on agricultural loans of all types – operating, intermediate and real estate. The St. Louis survey began in Q2 2012.
Source: Federal Reserve Surveys of Agricultural Credit Conditions
Farmland values remained mostly firm across Districts. In the Kansas City and St. Louis Districts, nonirrigated cropland values were unchanged from the previous year, while they grew slightly in the Chicago and Dallas Districts (Chart 4, left panel). However, regional conditions varied in their effects on farmland values, as values rose more than 5% in Northern Indiana, Kansas, and Texas, but fell 4% in South Dakota (Chart 4, right panel).
Chart 4: Nonirrigated Cropland Values
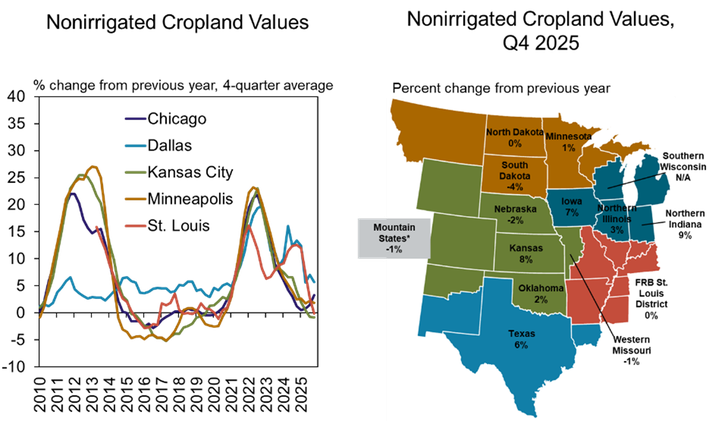
*Mountain States include Colorado, northern New Mexico and Wyoming, which are grouped because of limited survey responses from each state.
Source: Federal Reserve Surveys of Agricultural Credit Conditions
Federal Reserve Ag Credit Surveys Tables
Federal Reserve Ag Credit Surveys Historical Data
About the Federal Reserve Ag Credit Surveys
The views expressed are those of the authors and do not necessarily reflect the positions of the Federal Reserve Bank of Kansas City or the Federal Reserve System.
Authors

Francisco Scott
Senior Economist
