Weakness in the crop sector weighed further on farm finances, and credit conditions tightened gradually in the third quarter of 2025. According to Federal Reserve District Surveys of Agricultural Credit Conditions, farm income and loan repayment rates in the Midwest and Plains States declined at a pace similar to recent months. The depletion of working capital and tighter farm finances also drove steady increases in non-real estate loan demand and subdued capital spending by farm operations. Despite pressure from weaker farm finances, nonirrigated cropland values in most regions remained steady or increased slightly.
Strength in the cattle sector was expected to boost U.S. farm income in 2025, but profit opportunities for crop producers remained narrow, even with recent increases in prices, and continued to weigh on the outlook for the agricultural economy. Conditions have been particularly challenging for the most highly leveraged crop operations, but overall financial stress in the sector has remained limited with ongoing support from steady farmland values and a modest boost from aid associated with the American Relief Act earlier in the year.
Third Quarter Federal Reserve District Ag Credit Surveys
Agricultural credit conditions deteriorated gradually in the third quarter. Farm borrower income and loan repayment rates across all participating Federal Reserve Districts, on average, declined at a pace similar to recent months while renewal and extension activity also increased at a comparable rate (Chart 1). Farm finances have tightened alongside limited profit opportunities in the crop sector, but strength in the cattle sector has supported conditions in some areas.
Chart 1: Federal Reserve District Farm Income and Credit Conditions
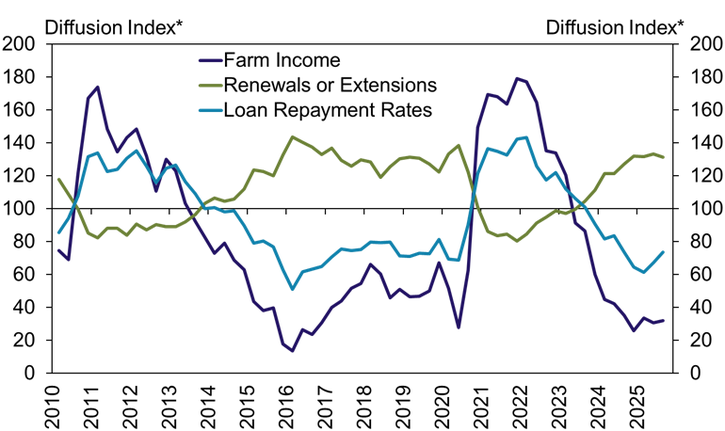
*Lenders responded by indicating whether conditions during the current quarter were higher than, lower than, or the same as in the year-earlier period. The index numbers are computed by subtracting the percentage of survey respondents who responded "lower" from the percentage who responded "higher" and adding 100.
Note: The farm income index is the average of individual indices for the Kansas City, Minneapolis and St. Louis Districts. The loan repayment rate and renewal or extensions index is the average of individual indices for the Dallas, Chicago, Kansas City, Minneapolis and St. Louis Districts.
Source: Federal Reserve Surveys of Agricultural Credit Conditions
Demand for financing also rose gradually and fund availability was steady. Non-real estate loan demand increased at a pace similar to the past year on average across all regions, but was strongest in the Chicago, Kansas City and Minneapolis regions (Chart 2). Fund availability was nearly unchanged on average but declined modestly in the Chicago, Minneapolis and St. Louis Districts.
Chart 2: Federal Reserve District Non-Real Estate Farm Loan Demand and Availability of Funds
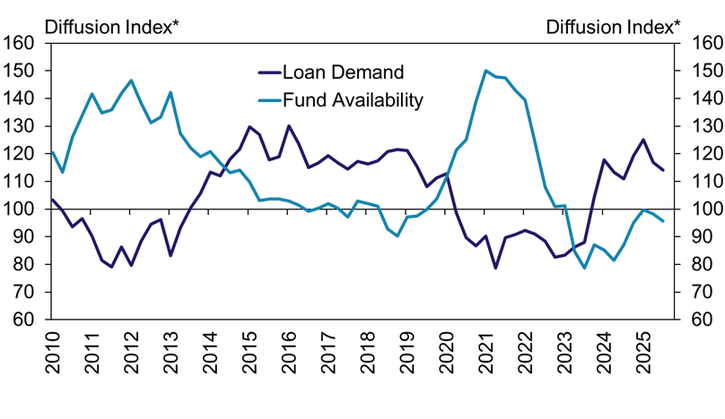
*Lenders responded by indicating whether conditions during the current quarter were higher than, lower than, or the same as in the year-earlier period. The index numbers are computed by subtracting the percentage of survey respondents who responded "lower" from the percentage who responded "higher" and adding 100.
Note: Each index is the average of individual indices for the Chicago, Dallas, Kansas City, Minneapolis and St. Louis Districts.
Source: Federal Reserve Surveys of Agricultural Credit Conditions
Capital spending by farms was still subdued alongside tight finances while household spending showed signs of stabilizing. On average across all contributing Districts, capital spending declined at the fastest pace since early 2020 (Chart 3). Household spending was nearly unchanged for the second consecutive quarter following several years of steady growth.
Chart 3: Federal Reserve District Farm Borrower Spending
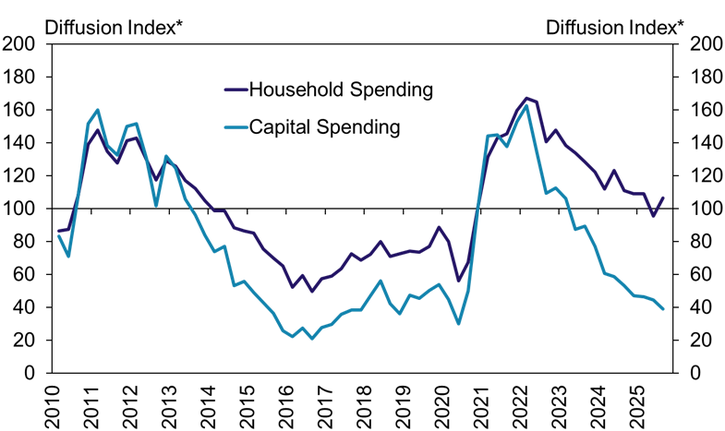
*Lenders responded by indicating whether conditions during the current quarter were higher than, lower than, or the same as in the year-earlier period. The index numbers are computed by subtracting the percentage of survey respondents who responded "lower" from the percentage who responded "higher" and adding 100.
Note: Each index is the average of individual indices for the Kansas City, Minneapolis and St. Louis Districts.
Source: Federal Reserve Surveys of Agricultural Credit Conditions
Despite pressure from weaker farm financial conditions, agricultural real estate values remained firm. The value of nonirrigated cropland changed by less 5% over the past year in most portions of the Midwest and Plains (Chart 4). As of the third quarter, cropland values increased from a year ago in more than half of all states covered by the surveys with strong growth in Oklahoma and Texas.
Chart 4: Federal Reserve District Nonirrigated Cropland Values
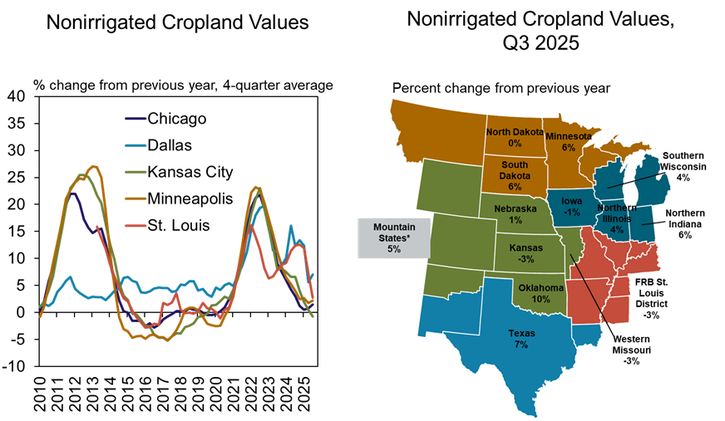
*Mountain States include Colorado, northern New Mexico and Wyoming, which are grouped because of limited survey responses from each state.
Source: Federal Reserve Surveys of Agricultural Credit Conditions
Federal Reserve Ag Credit Surveys Historical Data
Federal Reserve Ag Credit Surveys Tables
About the Federal Reserve Ag Credit Surveys
The views expressed are those of the authors and do not necessarily reflect the positions of the Federal Reserve Bank of Kansas City or the Federal Reserve System.
Author
