Agricultural credit conditions remained strong in the first quarter, but improvement slowed alongside some moderation in the farm economy. The pace of increase in farm loan repayment rates and farm income was slower than previous quarters in all participating Districts. Interest rates on agricultural loans moved higher alongside further increases in benchmark rates and collateral requirements also increased at a slightly larger share of banks. Despite higher interest rates and more measured farm incomes, agricultural real estate values continued to rise at a firm pace.
Farm finances have been bolstered by historically strong incomes in recent years, but higher production expenses and some retraction in commodity prices have tempered the outlook for profits. Repayment capacity has been exceptionally strong and pushed farm loan delinquency rates to historically low levels. A buildup of liquidity in recent years has supplemented credit usage for some farms, but higher input costs have necessitated increases in credit lines for others. Current prices for most major commodities have preserved modest profit margins for many producers, but lenders continued to highlight production costs, higher interest rates and weather conditions as key risks in the months ahead.
First Quarter Federal Reserve District Ag Credit Surveys
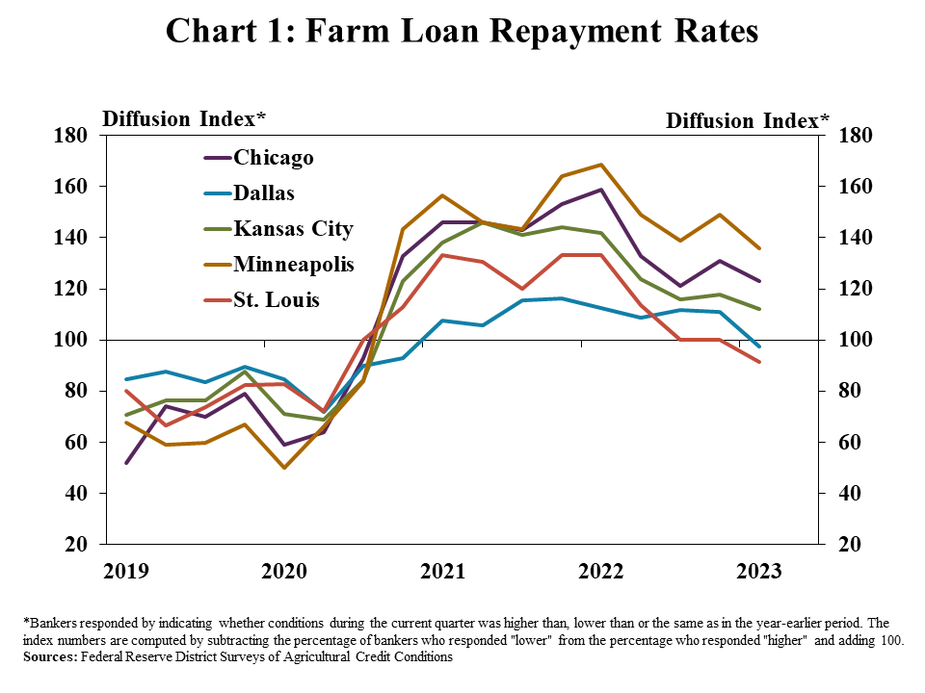
Improvement in credit conditions showed signs of moderating in the first quarter. The pace of increase in farm loan repayment rates slowed in the first quarter according to Federal Reserve Surveys of Agricultural Credit Conditions (Chart 1). Repayment rates continued to increase in the Chicago, Kansas City, and Minneapolis regions, but deteriorated slightly in the Dallas and St. Louis areas.
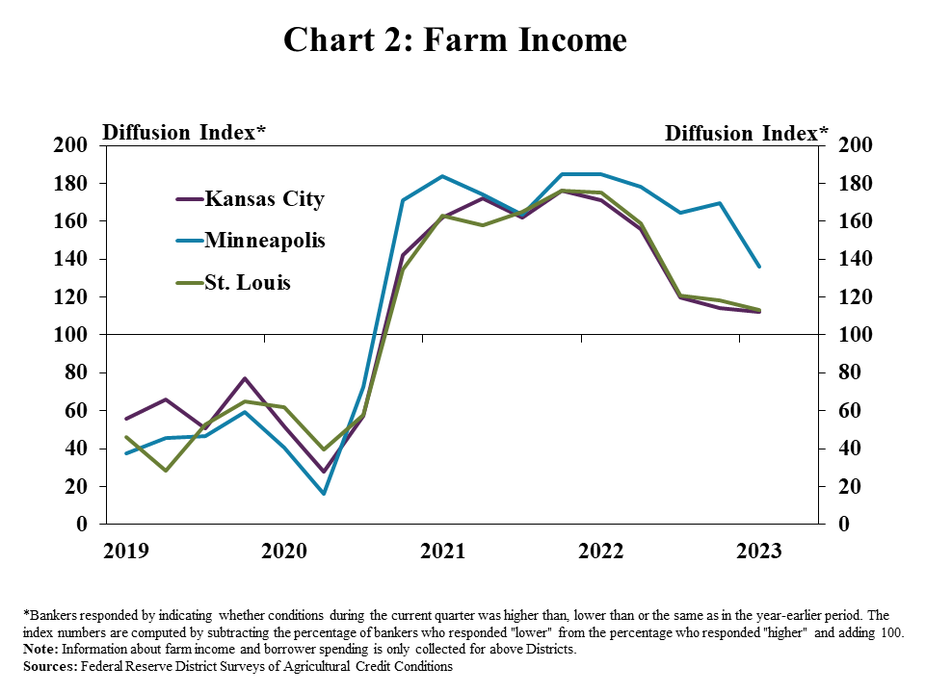
Loan repayment rates have steadied alongside a moderation in farm income. Similar to credit conditions, the pace of improvement in farm income slowed in all participating Districts (Chart 2). Despite a more gradual increase in income, farm finances remained strong following multiple years of exceptionally strong conditions for many producers.
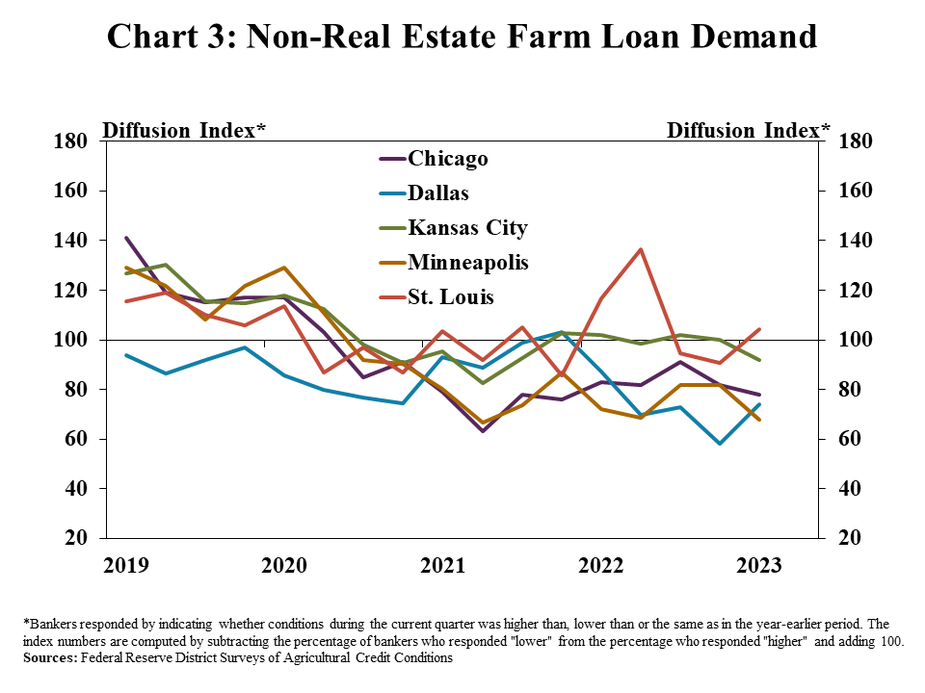
Broad strength in income and liquidity during recent years continued to keep loan demand muted for many lenders. Demand for non-real estate farm loans remained lower than a year ago in all regions except St. Louis (Chart 3). Bankers continued to report that many borrowers have utilized ample cash reserves to reduce credit usage.
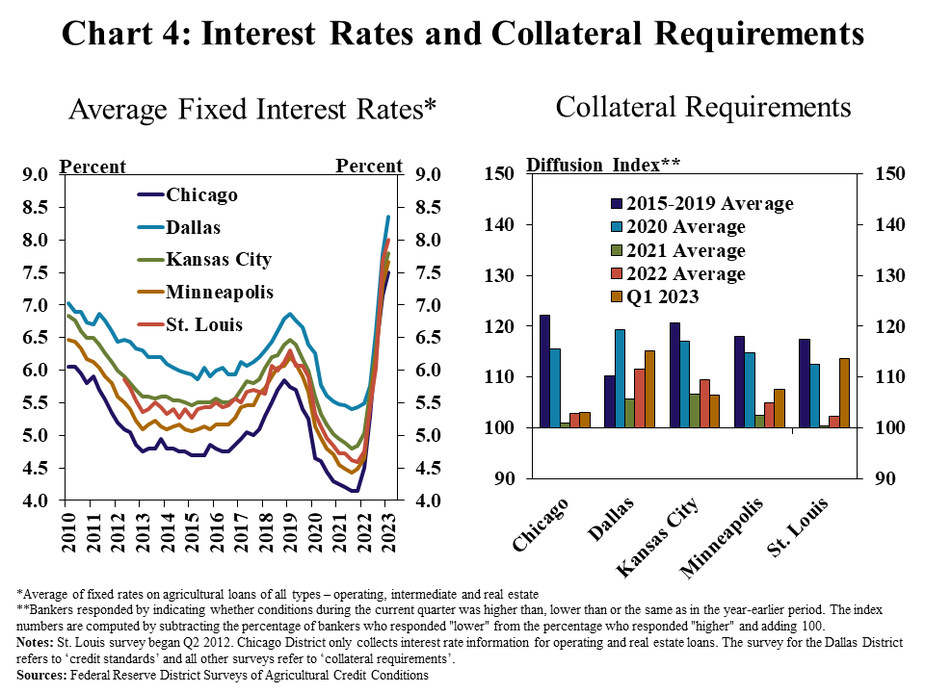
Farm loan demand has also remained subdued alongside higher interest rates and modest tightening in lending standards. On average, farm loan interest rates were 40 basis points and 300 basis points higher than last quarter and a year ago, respectively (Chart 4). In addition, the share of banks reporting that credit standards had increased from a year ago was also higher than recent years.
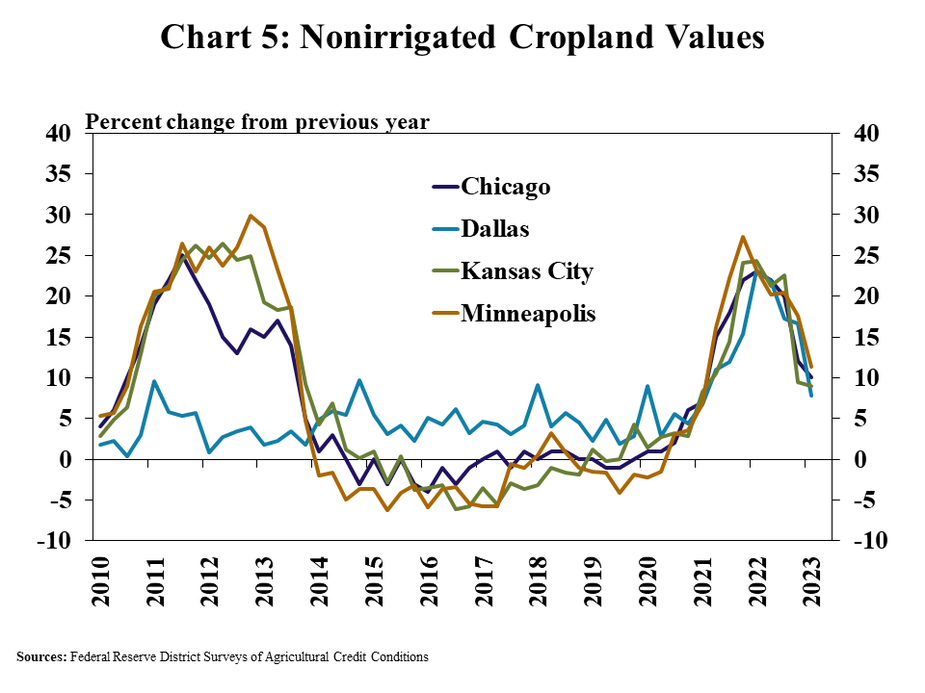
Farm real estate values continued to increase at a solid pace despite downward pressure from higher interest rates and some moderation in farm profits. The value of nonirrigated farmland was about 10% higher than a year ago across all reporting regions (Chart 5). The pace of growth in agricultural real estate values has slowed from rapid increases in 2021 and 2022, but remained resilient.
Data and Information
Federal Reserve Ag Credit Surveys Historical Data
Federal Reserve Ag Credit Surveys Tables
External LinkAbout the Federal Reserve Ag Credit Surveys
The views expressed are those of the authors and do not necessarily reflect the positions of the Federal Reserve Bank of Kansas City or the Federal Reserve System.
Authors

Nate Kauffman
Senior Vice President, Economist, and Omaha Branch Executive; Executive Director of the Center for Agriculture and the Economy
