Agricultural credit conditions in the Tenth District remained strong and farm real estate values continued to increase, but growth has softened. Strength in farm real estate markets eased, but farmland values continued to increase despite downward pressure from higher interest rates. Farm income moderated alongside a slight pullback in commodity prices during the first quarter slowing the pace of increase in loan repayment rates. While improvement in farm finances and credit conditions steadied and some lenders expected a degree of deterioration in the months ahead, multiple years of strong incomes continued to keep credit stress low.
The outlook for the U.S. farm economy in 2023 remained favorable as prices of key commodities were at multi-year highs. Elevated production expenses, higher interest rates and drought continued to present headwinds for many producers, but current commodity prices kept profit opportunities within reach. Higher production expenses pushed many producers to increase lines of credit, but others also pursued cost-cutting measures or utilized cash to reduce financing needs, dampening loan demand at many banks. Financial performance and liquidity at agricultural banks remained solid and farm lenders appeared well-positioned to meet higher credit demand through the early months of 2023.
Interest Rates and Farmland Values
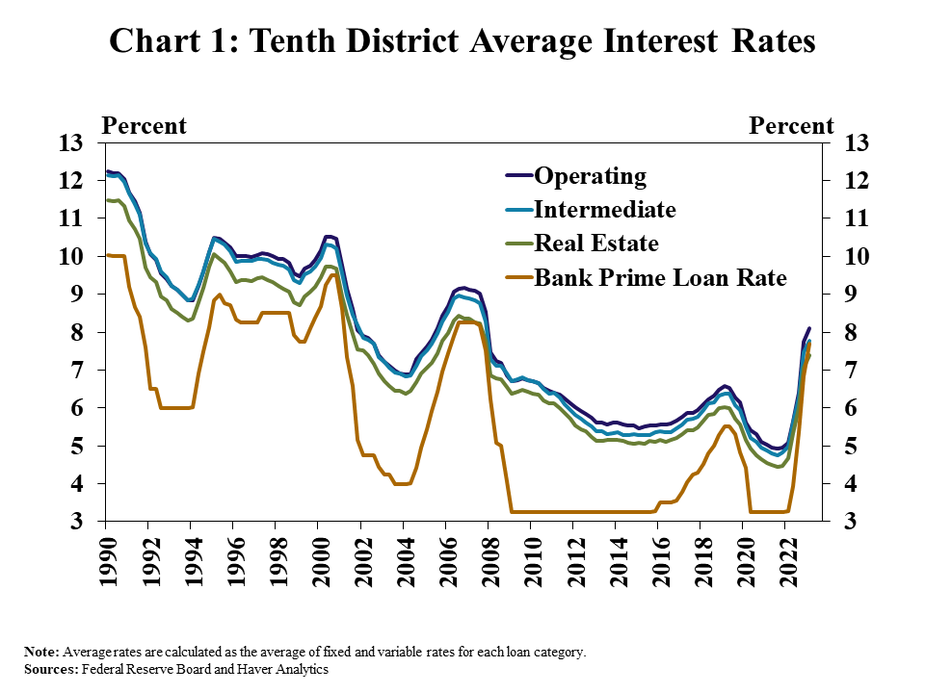
Farm loan interest rates rose alongside further increases in benchmark rates. The average rate charged on agricultural loans was about 30 basis points higher than the previous quarter and nearly 300 basis points higher than a year ago (Chart 1). Farm loan interest rates climbed alongside increases in the federal funds rate and other key benchmarks and pushed credit expenses up considerably.
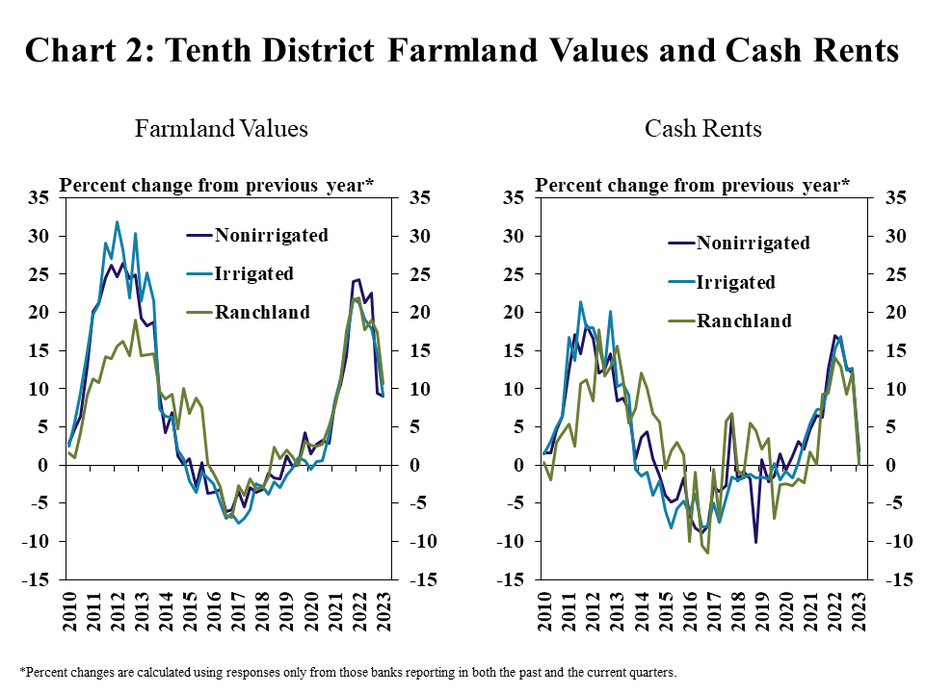
Growth in farm real estate markets has softened as interest rates have risen, but land values still continued to increase in the first quarter. The pace slowed from the rapidly accelerating growth in early 2022, but the value of agricultural land increased about 10% from a year ago (Chart 2, left panel). Cash rents on farmland have increased alongside growth in land values, but steadied quickly in the first quarter (Chart 2, right panel).
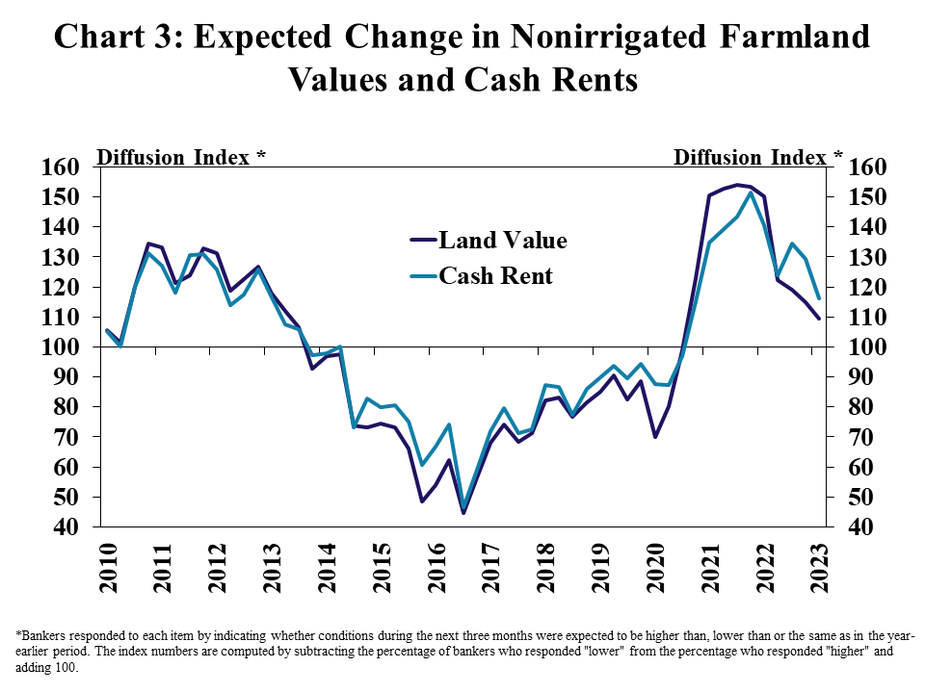
The outlook for land values and cash rents shifted considerably over the past year. Only about 20% of respondents expected an increase in nonirrigated farmland values in the coming months, compared with 50% who anticipated growth in values this same time a year ago (Chart 3). A similar path was expected for cash rental rates, with about 20% of banks expecting an increase in the next quarter.
Farm Income and Credit Conditions
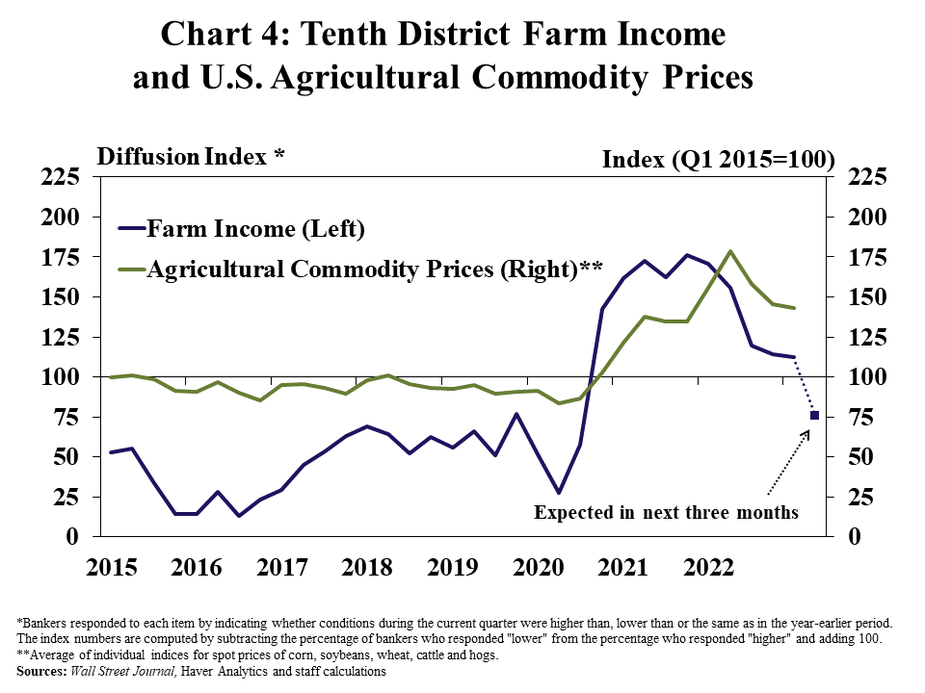
The acceleration in farm real estate values also slowed alongside a moderation in farm income. About 40% of respondents reported that income was higher than a year ago and 25% reported that income was lower (Chart 4). The prices of some key commodities have retracted from historically high levels in recent months and production costs remained elevated, putting downward pressure on profit margins and tempering the outlook for liquidity and farm income.
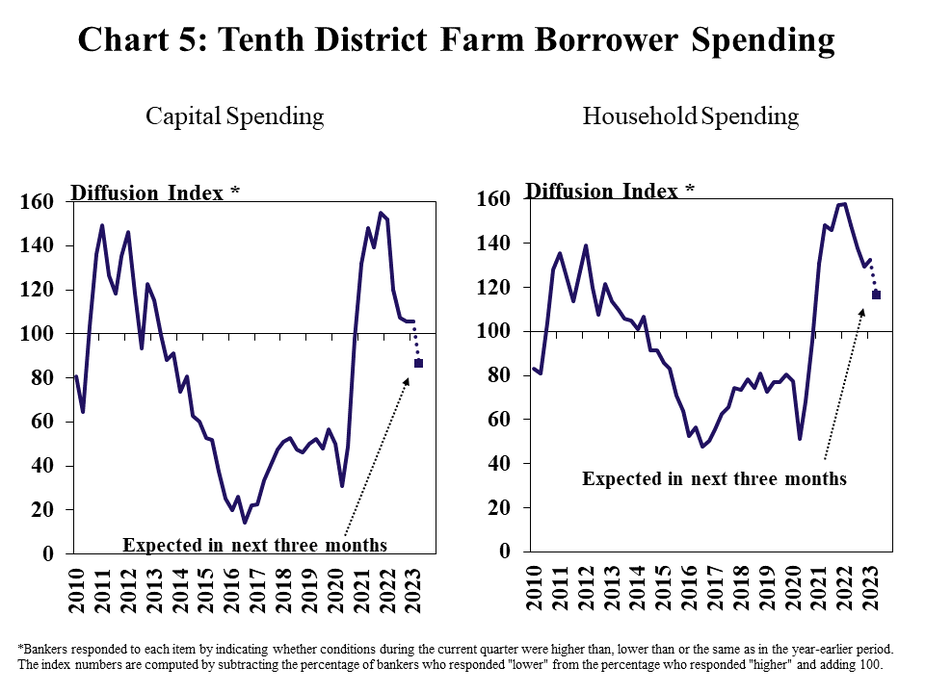
Capital spending flattened quickly in recent quarters while household spending continued to grow more steadily. The pace of increase in farm borrower capital spending was measured, with 30% and 25% of banks reporting higher and lower spending compared with last year, respectively (Chart 5, left panel). Alongside broad inflationary pressures, household spending increased at a firmer pace and nearly 50% of banks indicated that farm borrowers increased their household spending (Chart 5, right panel).
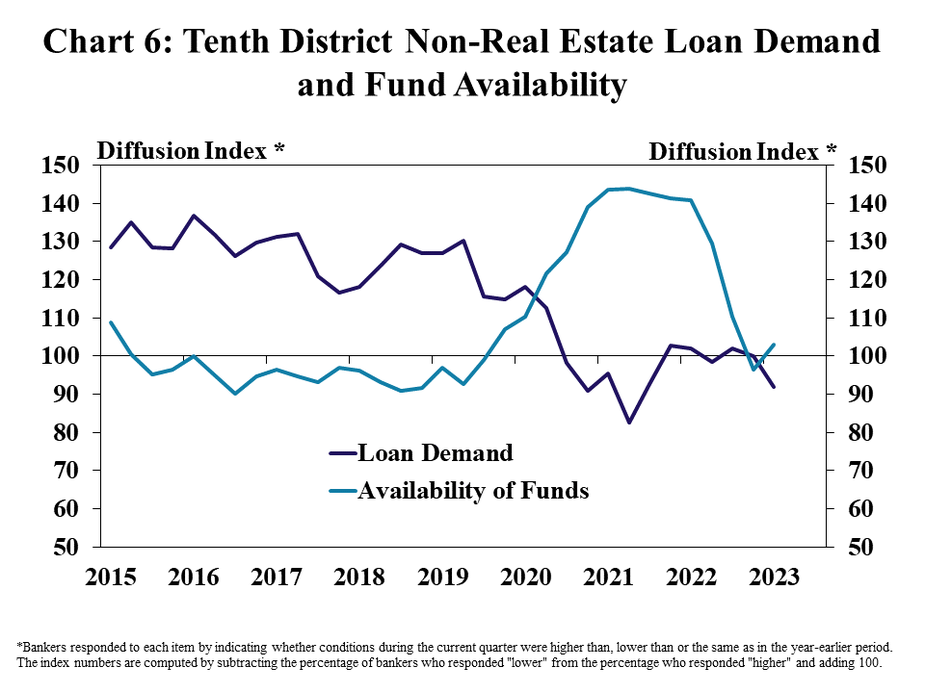
Strong farm income in recent years has bolstered borrower liquidity and continued to dampen loan demand at many banks. Non-real estate farm loan demand was less than a year ago at nearly 30% of reporting banks and higher at 20% (Chart 6). Despite some moderation in recent months, liquidity at agricultural banks remained sufficient to meet credit demands and 75% of respondents indicated availability of funds was unchanged from a year ago.
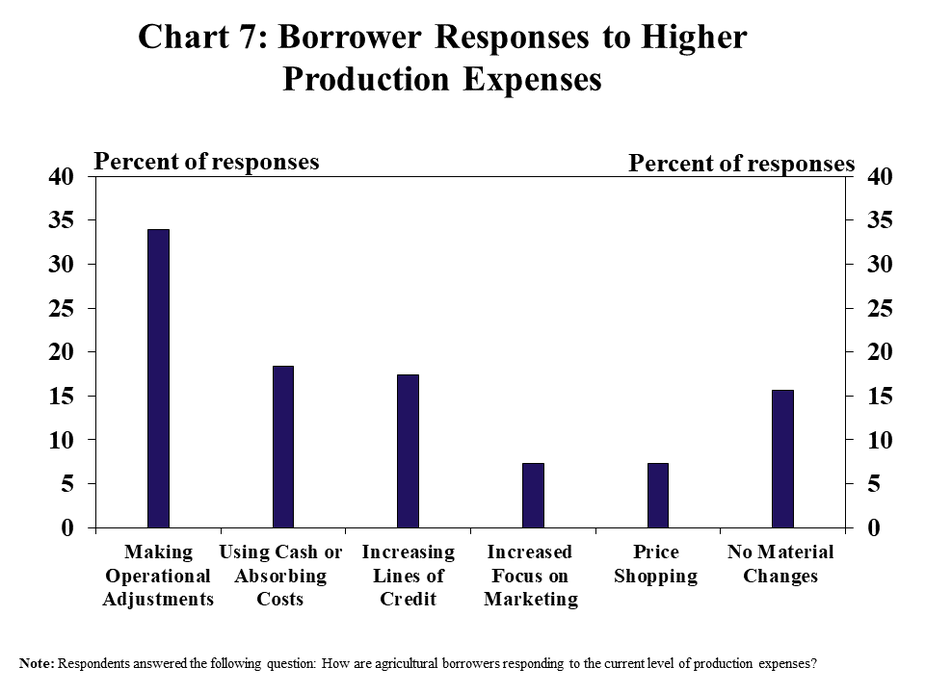
Elevated production costs have led many producers to cut costs or request credit line increases. According to respondents, many producers tried to reduce expenses by making changes or becoming more diligent about monitoring costs, and others have increased credit usage (Chart 7). Many borrowers also utilized cash reserves to reduce lending needs and interest expense as financing costs have also increased considerably alongside higher interest rates.
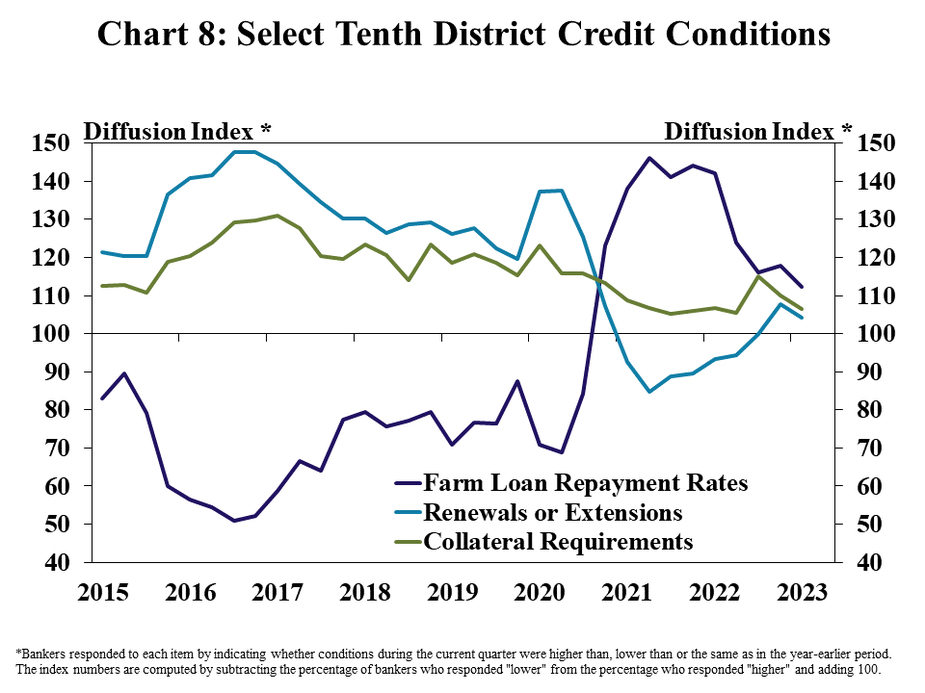
Agricultural credit conditions remained strong, but improvement has steadied with farm income. The pace of increase in farm loan repayment rates continued to slow gradually across the District, along with other measures of credit conditions (Chart 8). About 20% of banks reported higher repayment rates than a year ago, and about 75% indicated no change.
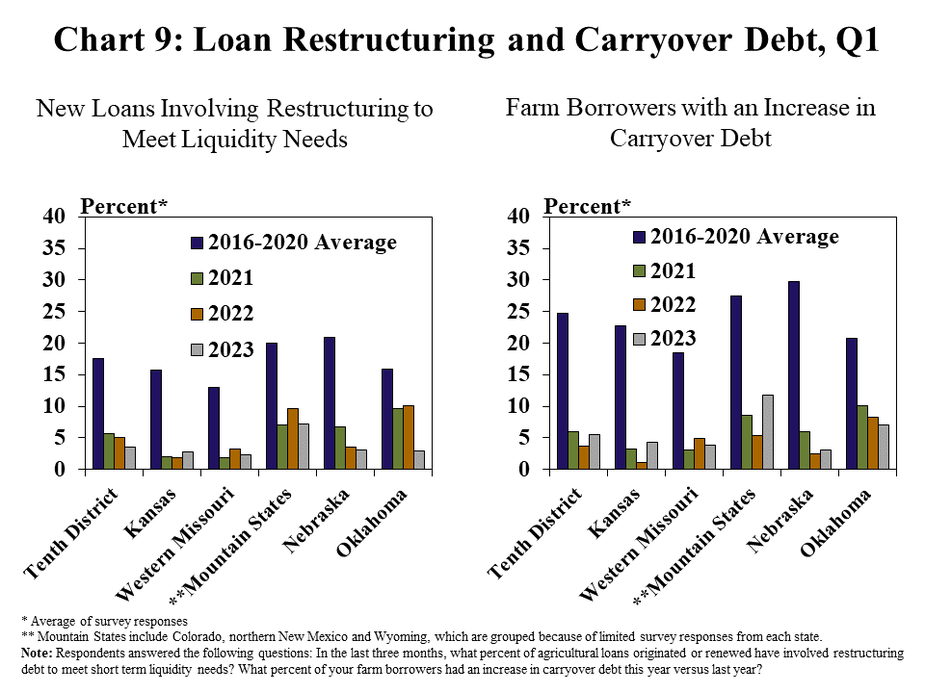
Broad strength in farm finances continued to keep credit stress low as borrowers renewed operating loans. The share of new loans involving restructuring remained at multi-year lows across all states in the District (Chart 9, left panel). Despite ticking up slightly in Kansas and the Mountain States, the percent of borrowers with carryover debt also remained low throughout the region (Chart 9, right panel).
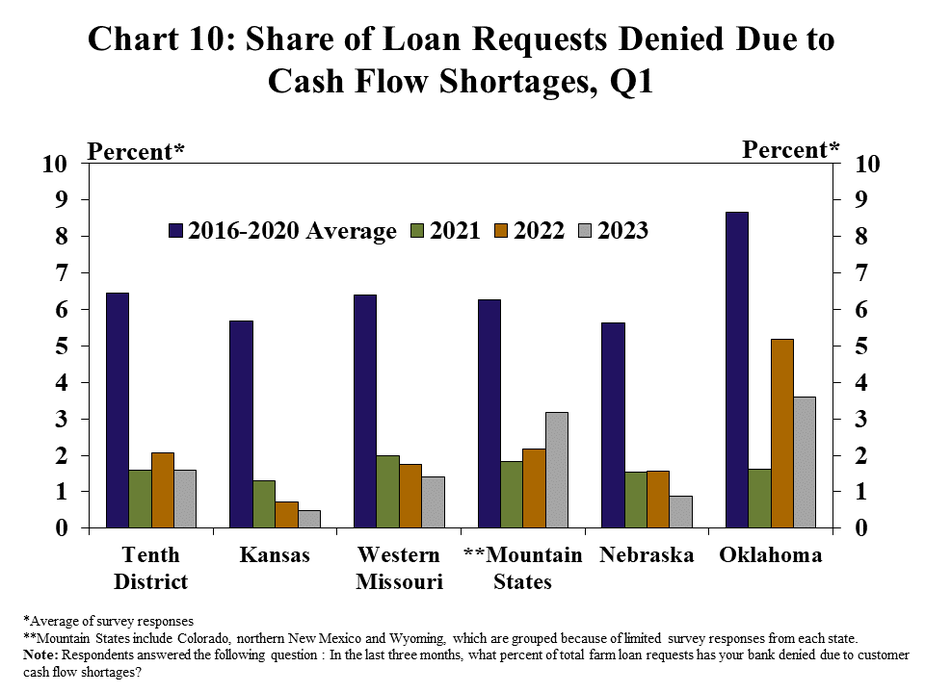
Loan denials due to financial constraints also continued to be limited. Lenders across the region indicated on average, less than 2% of all loan requests were denied due to cash flow shortages (Chart 10). Rates of denial dropped slightly from a year ago in all states except the Mountain States.
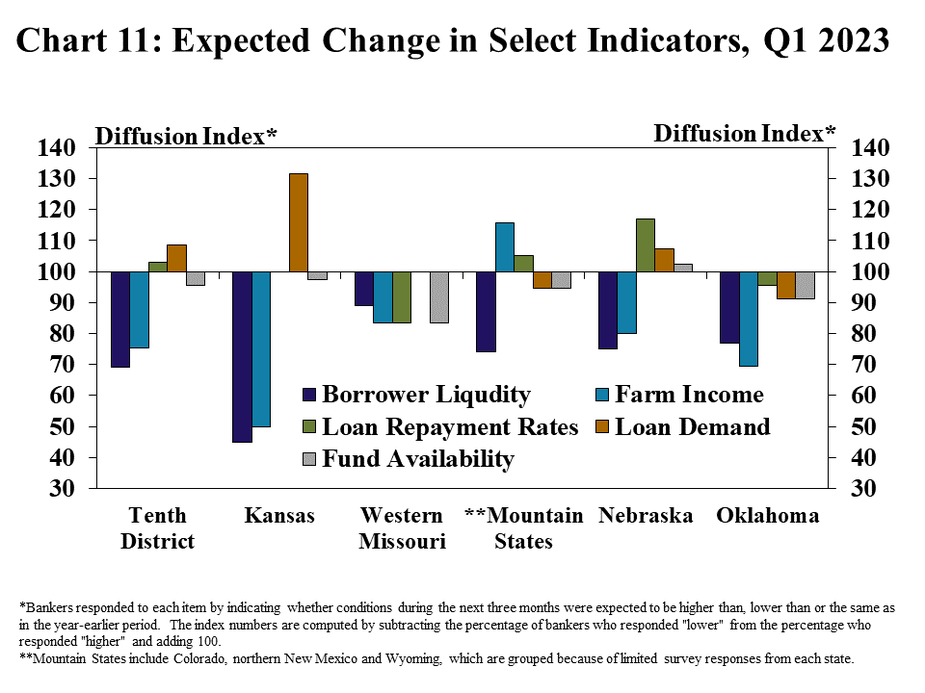
While agricultural credit conditions remained strong, pessimism about the outlook grew slightly. With a drop in commodity prices and high input costs, many lenders across the region expected farm income and borrower liquidity to contract from historically high levels a year ago (Chart 11). Alongside the expected moderation in incomes, a small number of banks also anticipated some deterioration in loan performance and higher lending demand.
Banker Comments Q1 2023
“We expect a difficult year as a result of the increase in input costs. Farm profits are high with commodity prices, but livestock operations are not experiencing that level of profitability.” – Northern Wyoming
“The rise in interest rates is having a significant impact on farm borrowers”– Northeast Colorado
“Cattle markets are trending upward and hay stocks continue to be a regional and nationwide issue.”– Northeast Wyoming
“If drought continues then operators will probably have carryover debt. Crop insurance has carried the current borrowers.”– Northwest Kansas
“Rising interest rates are affecting farmland values and drought conditions will cut wheat production this summer.”– Southwest Kansas
“The limited amount of moisture is causing higher feed prices for cattle producers. It is also causing higher priced cattle for those buying cattle.”– Northcentral Kansas
“Rates are beginning to get more consideration as farmers contemplate their needs and wants and loan costs.”– Central Missouri
“With higher interest rates on operating lines, farmers are selling carry over grain earlier in the year and using the proceeds to pay for inputs instead of using credit.”– Southwest Missouri
“Rising interest rates will continue to have a significant negative impact on loan volume and capital investments by farmers and ranchers.”– Northwest Missouri
“Most operators lost working capital in 2022, but earnings were mixed. Higher interest rates will adversely affect 2023 profitability.”– Southwest Nebraska
“The biggest concerns are lack of moisture, higher interest rates, lower commodity prices, and higher input costs.”– Northeast Nebraska
“Farmers are sitting well on working capital. Any farmer with a loss in 2022 was due to drought and crop insurance helped cover some of it.”– Southeast Nebraska
“Increasing interest rates and dry conditions are stressing agriculture credit.” – Southwest Oklahoma
“Grain prices helped offset higher inputs but that could change if markets don't hold. The drought in our area is by far the biggest obstacle at this time.” Northwest Oklahoma
“Most customers have reduced their cattle herds due to drought and feed.” Central Oklahoma
Data: Credit Conditions | Fixed Interest Rates | Variable Interest Rates | Land Values
A total of 140 banks responded to the First Quarter Survey of Agricultural Credit Conditions in the Tenth Federal Reserve District—an area that includes Colorado, Kansas, Nebraska, Oklahoma, Wyoming, the northern half of New Mexico and the western third of Missouri. Please refer questions to Nathan Kauffman, economist or Ty Kreitman, assistant economist at 1-800-333-1040.
The views expressed are those of the authors and do not necessarily reflect the positions of the Federal Reserve Bank of Kansas City or the Federal Reserve System.
Authors

Nate Kauffman
Senior Vice President, Economist, and Omaha Branch Executive; Executive Director of the Center for Agriculture and the Economy
