Farm lending slowed alongside the initial effects of the pandemic and a more pessimistic outlook for agricultural economic conditions. The volume of total non-real estate farm loans continued into a yearlong trend of declines during the second quarter of 2020. The slowdown in lending generally was consistent across all types of loans. Delinquency rates on farm loans increased at a steady pace through the first quarter and agricultural credit conditions remained weak. Recently implemented government lending programs (Paycheck Protection Program (PPP) and Economic Injury Disaster Loans) likely supplemented the financing needs of some producers while direct aid payments may help offset declines in farm revenues in 2020.
Section A – Second Quarter National Farm Loan Data
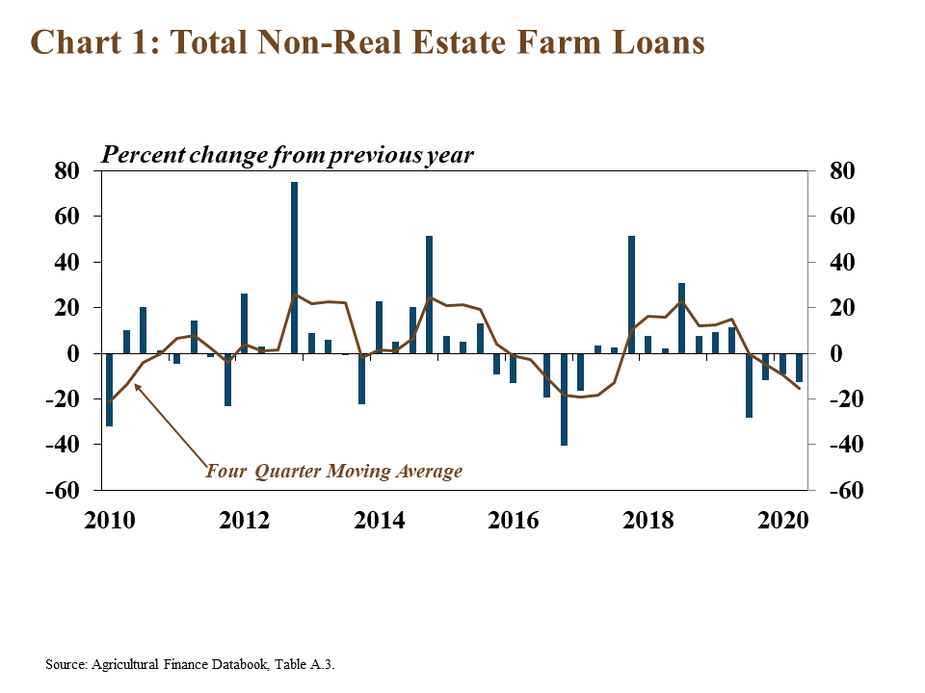
Agricultural financing activity slowed in the second quarter, according to the Survey of Terms of Lending to Farmers. The volume of total non-real estate loans declined for the fourth consecutive quarter, decreasing about 13% from a year ago (Chart 1). Over the past year, lending activity has declined at an average rate of over 15%. This measure of farm lending excludes loans provided to producers through the Small Business Administration (SBA) PPP, which may have replaced traditional financing for some borrowers and supplemented existing operating lines for others.
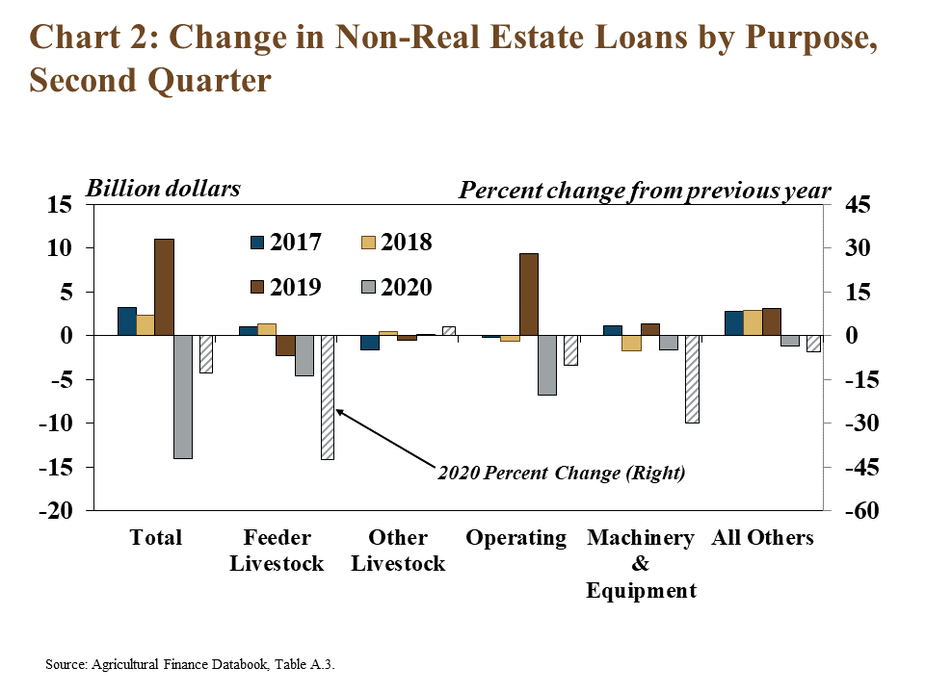
The overall reduction in lending was driven by a decrease in loans for nearly all purposes. While operating loans accounted for the largest share of the total decline in volume, the decrease in feeder livestock loans, in percentage terms, was notably more than other types of loans (Chart 2). Alongside sharp declines in cattle and hog prices during recent months, feeder livestock loans declined more than 40% from a year ago, compared with a 10% decrease in operating loans.
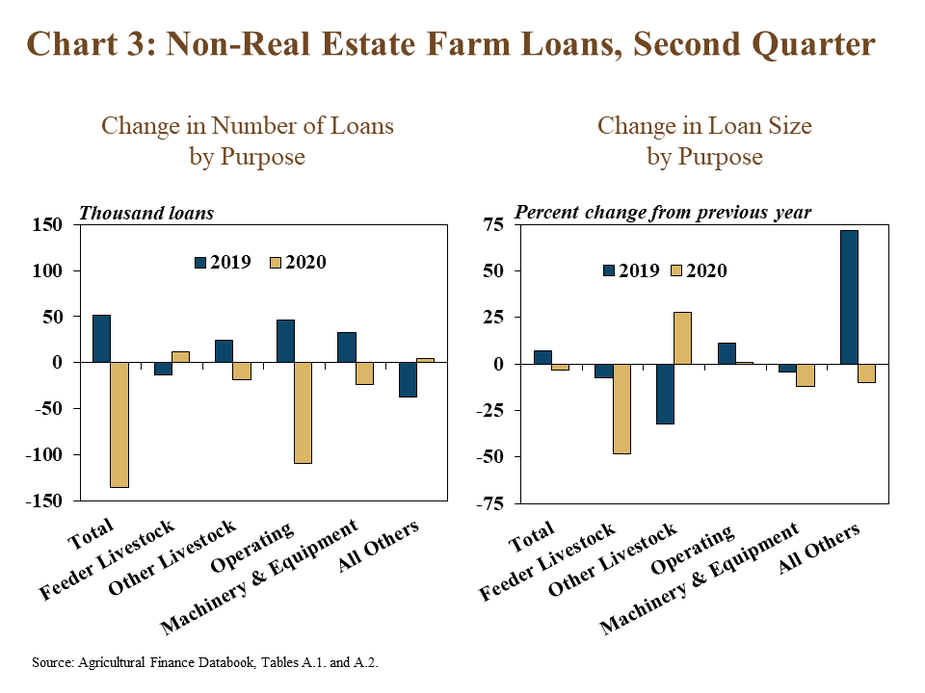
The decline in non-real estate lending also was attributed to a drop in the total number and average size of loans. The overall decrease in the number of loans was due largely to fewer operating loans being originated (Chart 3). In contrast to other types of loans, the number of loans for feeder livestock increased from a year ago. However, the average size of feeder livestock loans was nearly 50% less than a year ago.
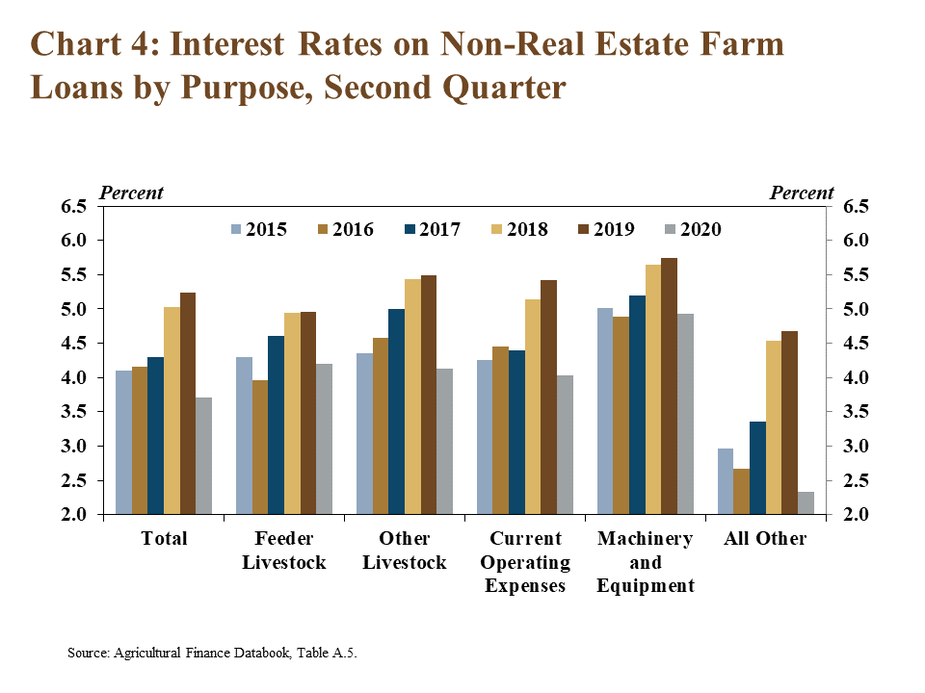
Interest rates on non-real estate loans decreased alongside a decline in benchmark rates. The average rate charged on all types of non-real estate loans neared historical lows in the second quarter (Chart 4). The rate charged on operating notes and loans for other livestock dropped at a slightly faster pace than other types. Overall, the average effective rate on non-real estate loans decreased by more than 150 basis points when including loans for unspecified purposes, which typically garner lower rates.
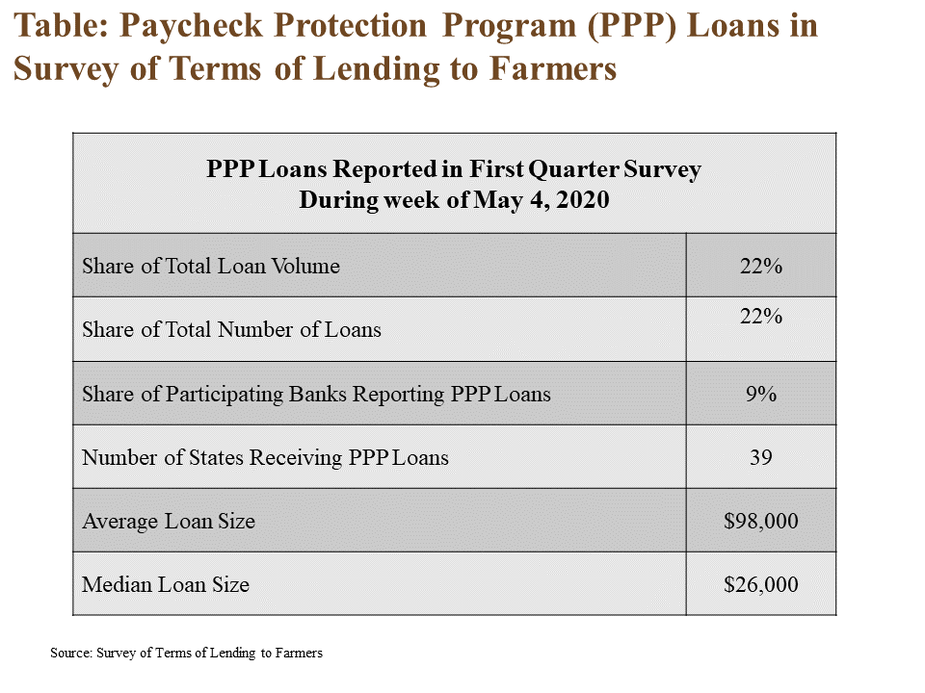
A portion of loans reported during the weeklong survey period in early May were secured through the PPP. Banks participating in the survey reported PPP loans totaling about $90 million to nearly 1,000 individual borrowers in 39 states (Table). The volume of PPP loans captured in the survey represented less than 2% of the total approvals for the agricultural sector reported by the SBA as of June 30. While some producers that had secured annual borrowing lines prior to implementation of the program likely were unable to qualify for the program, others likely were able to utilize the funds for eligible expenses.
Section B: First Quarter Call Report Data
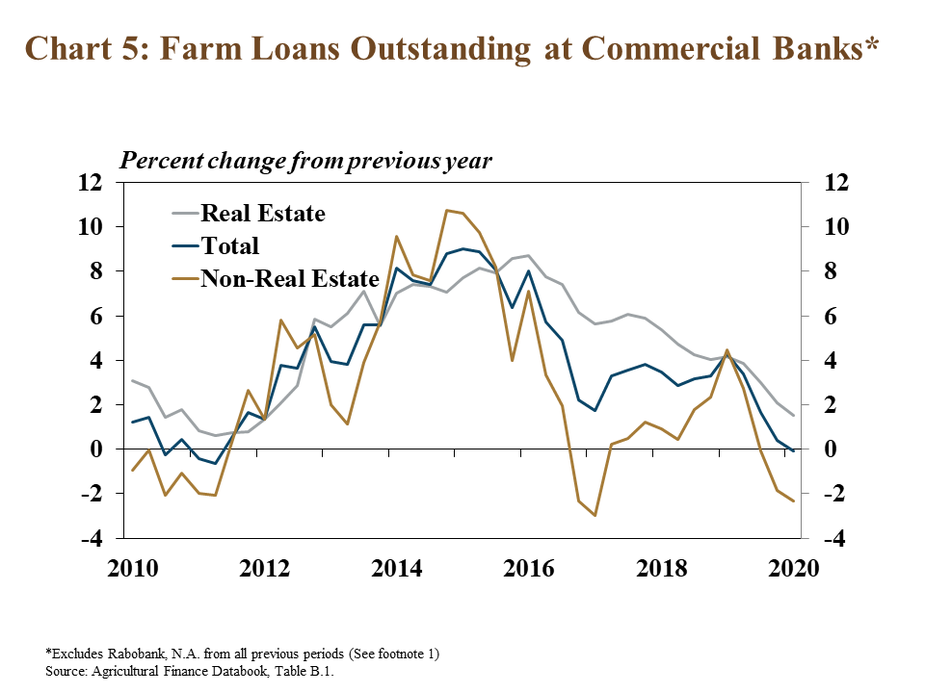
Ahead of a slowdown in new lending activity during the second quarter, first quarter Call Report data also pointed to signs of reduced farm debt at commercial banks. The rate of growth in farm real estate loans continued to slow and non-real estate loans declined more than 2%, leading to a slight decline in total farm debt outstanding (Chart 5). Excluding Rabo N.A. from all previous periods, this marked the third consecutive quarter of decline in non-real estate debt and the first decline in total agriculture loans in any quarter since 2011.1
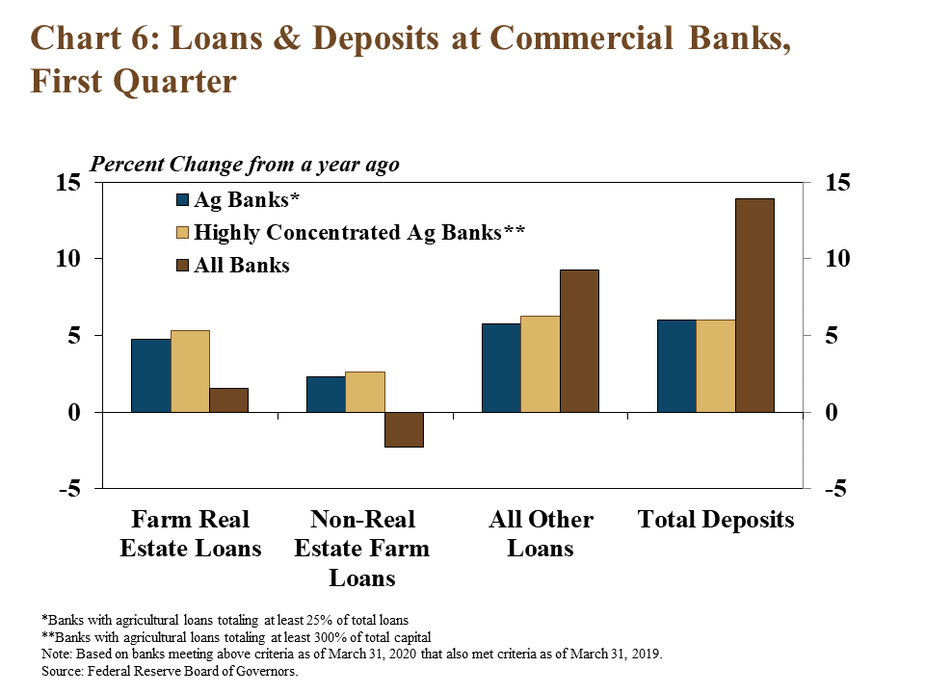
In contrast to trends in farm debt at commercial lenders in total, balances grew steadily at agricultural banks. Among agricultural banks in the first quarter, farm real estate and non-real debt increased by about 5% and 3%, respectively (Chart 6). Compared with all banks, all other types of loans increased at a slower rate for farm lenders. While nearly all depository institutions likely benefitted from customers seeking to hold larger amounts of assets in highly liquid forms, total deposits at agricultural banks grew at half the rate of all commercial banks.
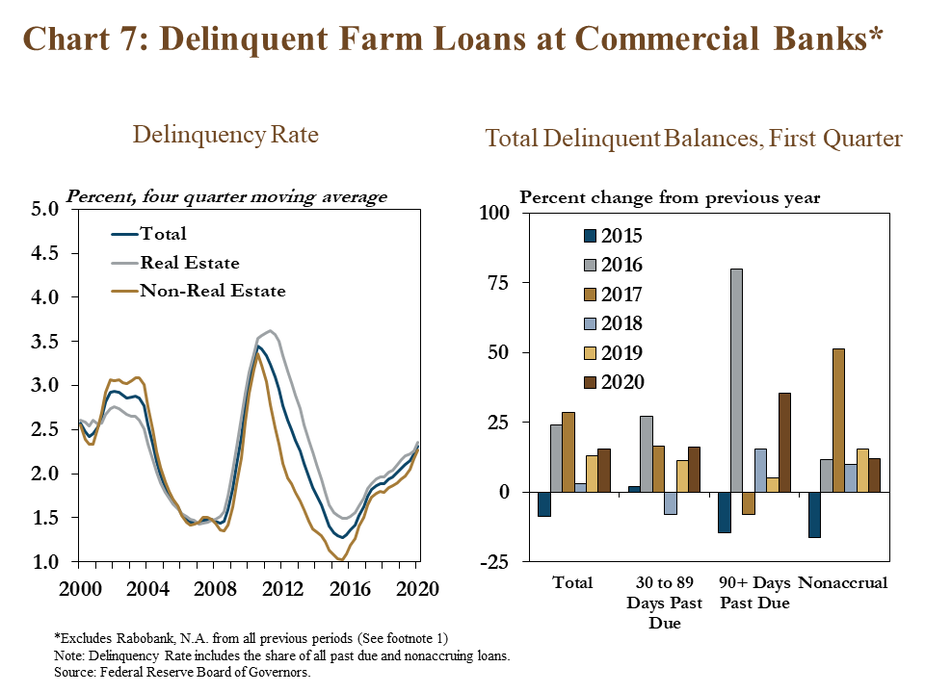
Alongside continued weaknesses in the agricultural economy and the initial effects of the pandemic, farm loan delinquency rates continued to edge higher. Excluding Rabo N.A. from all previous periods, the volume of delinquent farm real estate and non-real estate loans increased about 17% and 13%, respectively (Chart 7). The volume of loans past due more than 90 days continued to represent the smallest share of total delinquencies, but increased at a comparably faster rate, an indication that previously past due loans remained delinquent.
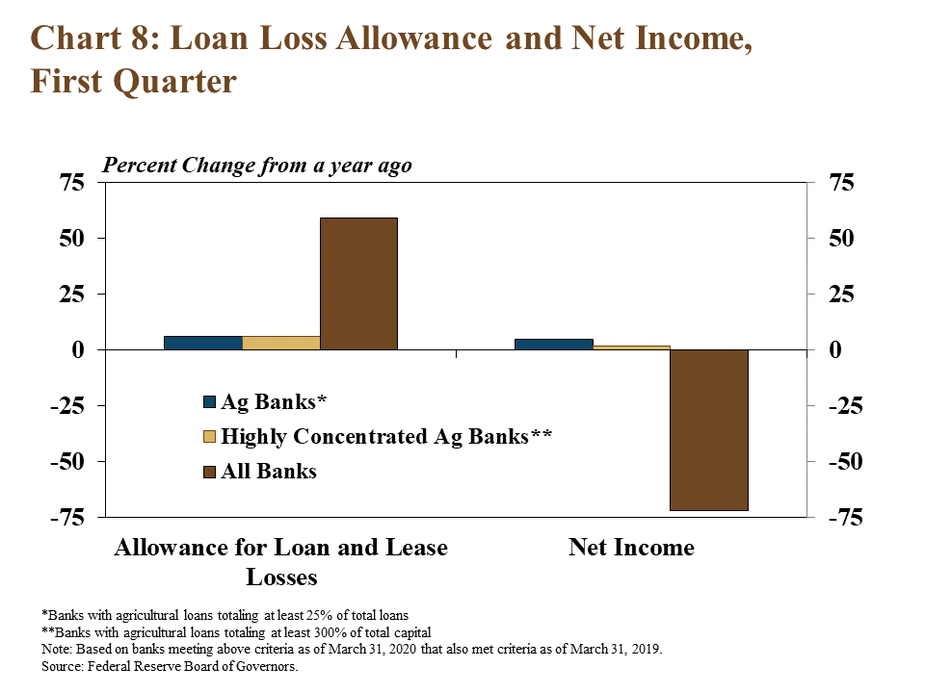
In contrast to the large increases in loan loss reserves among many commercial lenders, allowances at agricultural banks increased at a substantially lower rate. In anticipation of potential repayment issues resulting from a broad economic contraction and implementation of new accounting methodology, many banks bolstered accounts reserved for loan losses, contributing to large decreases in income (Chart 8). With less exposure to other types of lending and already strengthened allowances, agricultural banks increased reserves at a slower rate, which supported a slight increase in net income among those lenders.
Section C: First Quarter Regional Agricultural Data
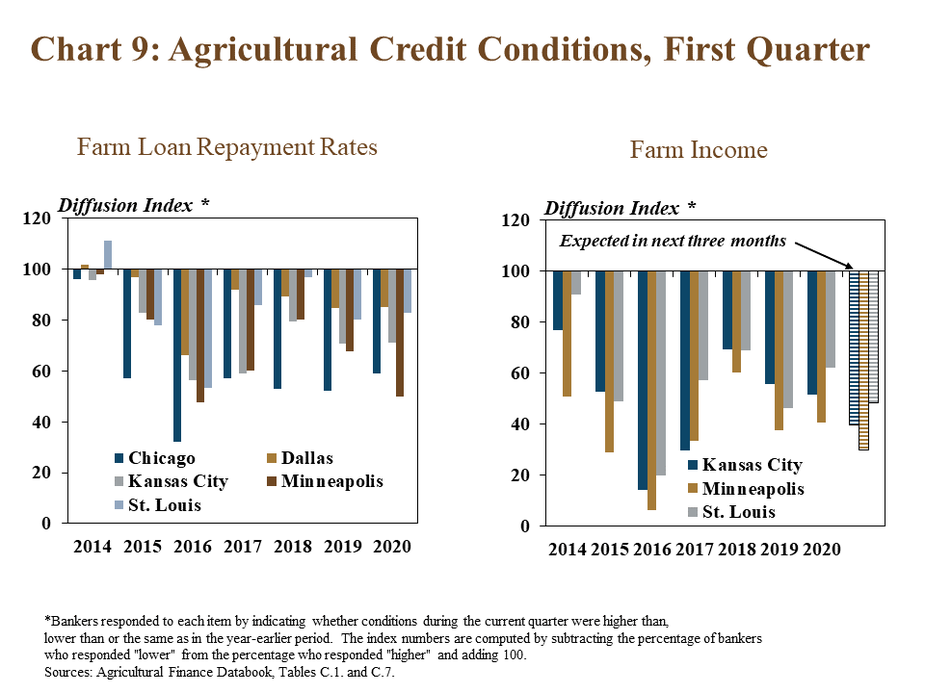
Alongside increases in farm loan delinquency rates, agricultural credit conditions remained weak in the first quarter. According to Federal Reserve District Surveys, farm loan repayment rates deteriorated at a steady pace across all regions in late March (Chart 9). Farm Income also remained weak in all reporting Districts and expectations about the coming months were slightly more pessimistic.
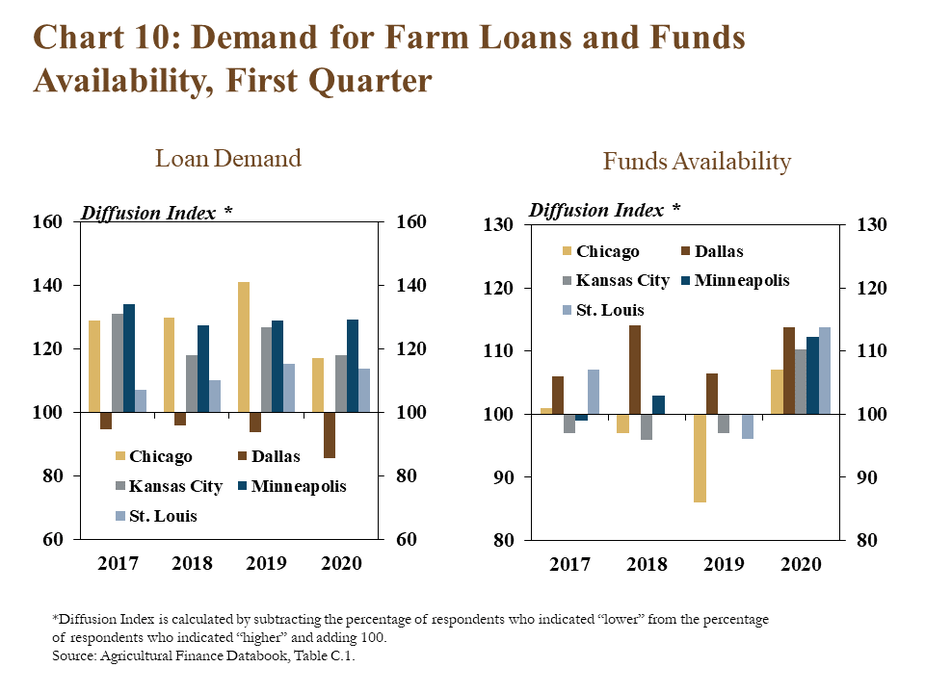
Similar to national trends, demand for farms loans at agricultural banks remained steady and fund availability increased. While the pace of increase slowed in some regions, farm loan demand continued to grow in all Districts except Dallas (Chart 10). As deposits at many commercial banks increased, liquidity at agricultural banks across all Districts was higher than a year ago
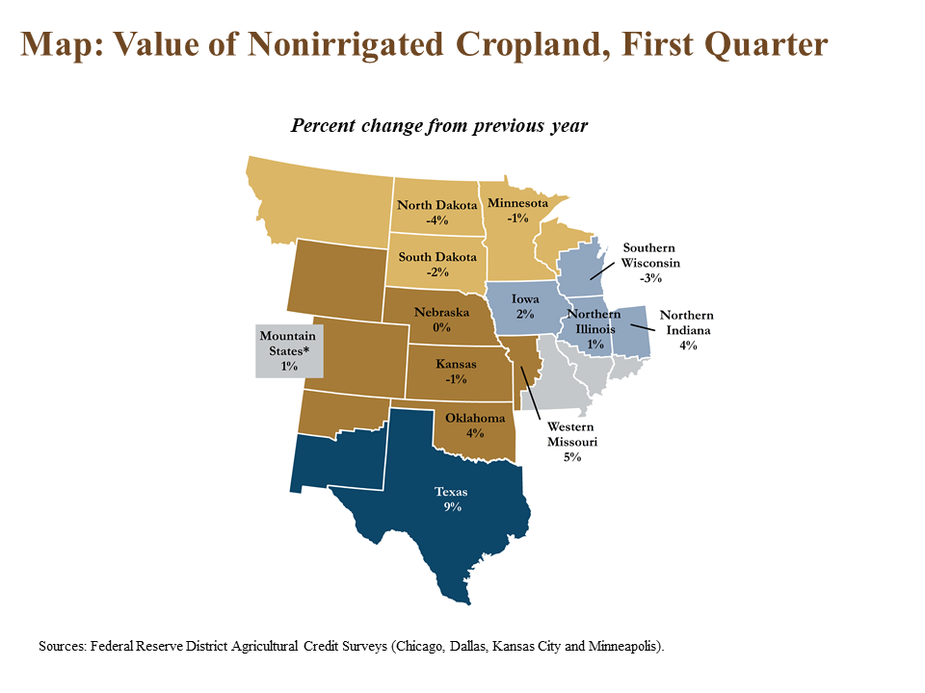
Despite a more pessimistic environment for farm income and credit conditions, farmland values remained relatively steady in the first quarter. Compared with the previous year, the value of nonirrigated cropland changed by less than 5% in all reporting states except Texas (Map). In states where values were lower than a year ago, the average decline was about 2%. Across all other states, values increased about 4% on average.
Conclusion
Agricultural lending at commercial banks appeared to soften further in the second quarter amid the ongoing pandemic. Financing secured through recent government lending programs likely supported the borrowing demands for some producers. However, a weak outlook for agricultural sector amid low commodity prices in the second quarter likely also weighed on lending activity. Delinquency rates on farm loans trended higher at a steady pace and there have been some signs of further liquidity stress among farm borrowers. Government payments in the agricultural sector appear likely to limit the severity of financial stress among farm borrowers in the coming months, but uncertainty about longer-term prospects is likely to remain elevated.
1 All outstanding agricultural loans previously held by Rabobank N.A. no longer are included in commercial bank reporting as of Sept. 31, 2019. Above charts exclude Rabobank N.A. from all previous periods. Data reported in Section B of Agricultural Finance Databook are not adjusted.
Data and Information
The views expressed are those of the authors and do not necessarily reflect the positions of the Federal Reserve Bank of Kansas City or the Federal Reserve System.
Authors

Nate Kauffman
Senior Vice President, Economist, and Omaha Branch Executive; Executive Director of the Center for Agriculture and the Economy
