Chart 1: Non-Real Estate Farm Loan Volumes by Purpose
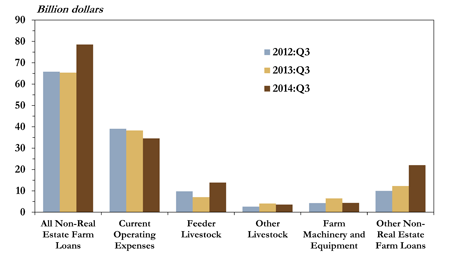
Chart 2: Current Operating Loan Volume
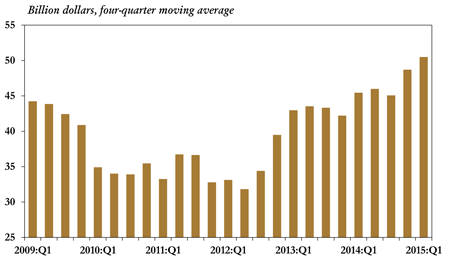
Chart 3: Ratio of Farm Loan Volume to Net Farm Income by Loan Type
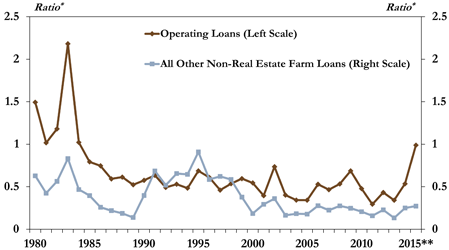
Chart 4: Operating Loan Share of Total Loan Volume by Size
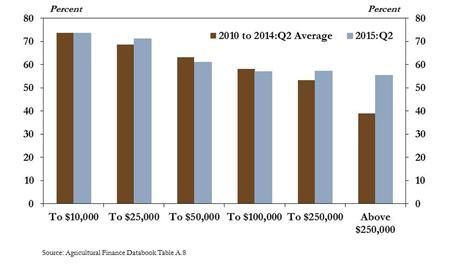
Chart 6: Average Effective Interest Rate on Non-Real Estate Farm Loans
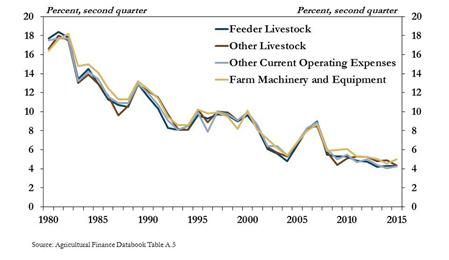
Chart 7: Shares of Non-Real Estate Farm Loans with Fixed Interest Rates by Purpose
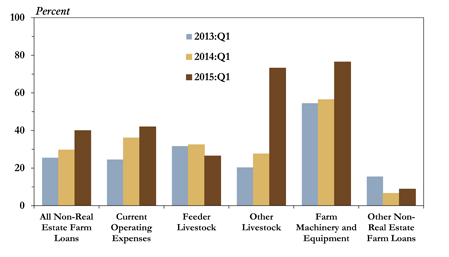
Chart 9: Delinquency Rates on Farm and Other Loans
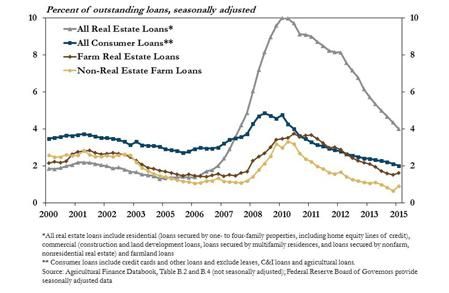
Chart 10: Charge-Off Rates on Farm and Other Loans
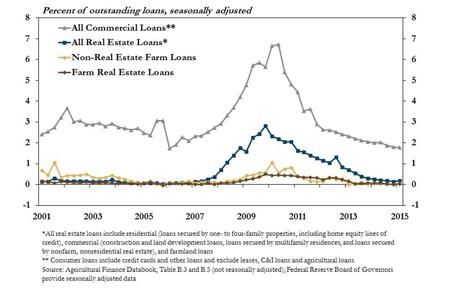
Chart 11: Distribution of Agricultural Banks by Share Nonperforming Loans
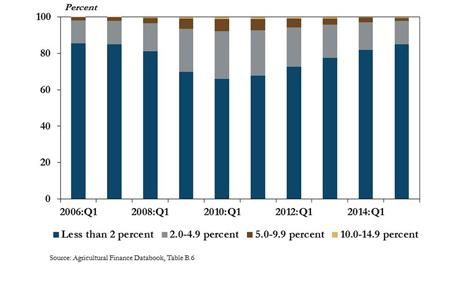
Chart 12: Rate of Return on Assets, First Quarter
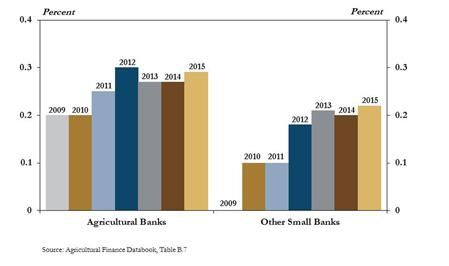
Chart 13: Farm Capital Spending and Farm Income
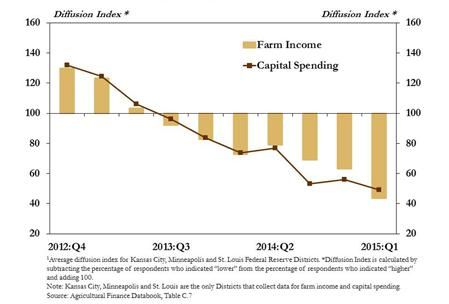
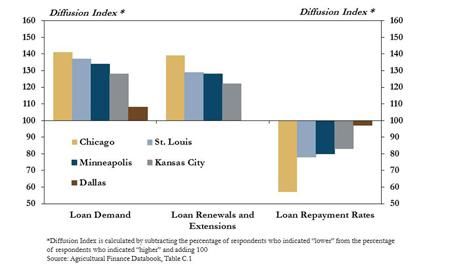
Chart 14: Selected Agricultural Credit Conditions, First Quarter 2015
Conclusions
Increasing needs for short-term operating loans and expectations of lower farm income suggest a slight increase in the risk associated with agricultural production in the United States. Although agricultural credit conditions generally weakened due to further declines in farm income, farm loan delinquency rates and charge-off rates have remained low. Agricultural banks have continued to post relatively strong returns, but bankers have expressed some concern that reduced cash flows could increase future risk for the farm sector.
Section A - Second Quarter National Farm Loan Data
Non-real estate farm loan volumes rose in the second quarter of 2015, driven again by a sharp increase in operating loans. The national Survey of Terms of Bank Lending to Farmers, conducted during the first full week of May, showed loan volumes for non-real estate farm loans increased 5 percent from the second quarter of 2014 (Charts 1 and 2). Operating loan volumes surged 25 percent from a year ago, offsetting an 18 percent drop in loan volumes for all other non-real estate farm loans.
Although loan volumes have increased steadily since 2011, recent increases have coincided with a period of declining farm income. According to the USDA, crop cash receipts have declined 22 percent since 2012, but costs associated with manufactured inputs, seeds and rent declined just 1 percent in the same period. Amid growing disparity between crop revenue and input costs, the ratio of current operating loan volumes to net farm income grew significantly in 2015 (Chart 3). In fact, the ratio of operating loans to farm income continued to rise, even as other non-real estate loan volumes, relative to farm income, moderated. The recent increases in operating loans have been driven, in part, by increases in large operating loans. In the second quarter, operating loans accounted for 55 percent of all loans greater than $250,000, compared with an average of 39 percent from 2010 to 2014 (Chart 4).
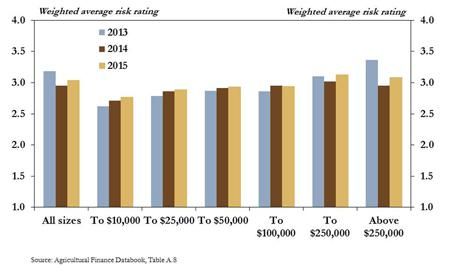
The recent increases in operating loans relative to farm income highlight a growing risk in the farm sector but, thus far, credit risk associated with farm loans has generally remained stable. In the second quarter, the average risk rating on all sizes of farm loans was near 3.0, indicating only moderate risk. A higher risk rating suggests a greater potential for future loss. Risk ratings on the largest loans were generally higher than for smaller loans, but have also remained fairly stable at about 3.0 (Chart 5).
Chart 5: Weighted Average Risk Rating on Farm Loans by Size of Loan
In addition to relatively stable credit risk, interest rates have also remained historically low. Average effective interest rates in the second quarter were at or below 5 percent on all types of non-real estate farm loans (Chart 6). Interest rates on farm loans, which reached a recent high of 8.7 percent in 2007, have been lower more recently and have generally trended lower since the early 1980s. Moreover, the share of non-real estate farm loans made with fixed interest rates has also risen in recent years, as borrowers have sought to lock in low rates, especially for operating loans (Chart 7).
Section B – First Quarter Call Report Data
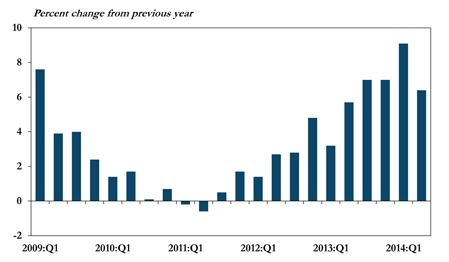
The recent survey data pointing to increased operating loan volumes have followed earlier data showing that total farm debt at commercial banks grew in the first quarter of 2015. According to commercial bank call report data, outstanding farm sector debt increased 9.3 percent from the first quarter of 2014 (Chart 8). Farm debt has continued to increase since the fourth quarter of 2011, and generally at a more rapid pace. Both real estate and non-real estate agricultural lending expanded significantly—8.0 percent and 10.8 percent, respectively—from the first quarter of 2014.
Chart 8: Farm Debt Outstanding at Commercial Banks
Despite ongoing increases in agricultural debt levels, delinquency rates and charge-off rates for farm loans have remained low. Non-real estate and real estate farm loan delinquency rates increased slightly in the first quarter, but remained below similar rates observed for other types of loans (Chart 9). Delinquency rates on both types of agricultural loans have also generally trended lower in recent years, despite a slight uptick in the first quarter of this year. Charge-off rates also remained comparatively small for both types of agricultural loans (Chart 10). Charge-off rates for real estate and non-real estate farm loans were below 0.1 percent, continuing a downward trend that started in 2010.
Nonperforming loans at agricultural banks are almost back to pre-recession levels and profits at agricultural banks have also strengthened. In fact, few banks have more than 5 percent of total loans ranked as nonperforming (Chart 11). Increasing loan volumes, coupled with a decline in the level of nonperforming loans, have continued to sustain profits at agricultural banks. To illustrate, returns at agricultural banks rose consistently through 2012 and have remained solid, even as farm incomes have declined more recently (Chart 12).
Section C – First Quarter Regional Agricultural Data
Federal Reserve Districts that report on both farm capital spending and farm income have shown steady declines since late 2013. Specifically, farm capital spending and farm income in the Kansas City, Minneapolis and St. Louis Districts have gradually weakened since the third quarter of 2013, even as loan volumes have trended higher (Chart 13). Illustrating the recent decline in capital spending, data from the Association of Equipment Manufacturers show that sales of four-wheel-drive tractors have declined 43 percent since June 2014 and combine sales have decreased 42 percent over the same period.
Federal Reserve District surveys of agricultural credit conditions also show that non-real estate farm loan demand increased in the first quarter. Consistent with national survey data from commercial banks, declines in larger, more capital-intensive purchases in the midst of expanding loan volumes highlight the growing demand for financing to cover input costs and other current operating expenses (Chart 14). Although loan demand has picked up and low loan delinquency rates generally highlight strong loan quality, other measures of agricultural credit conditions have weakened somewhat under the weight of reduced farm income. Loan repayment rates declined and loan renewals and extensions increased in the first quarter in each of the Federal Reserve Districts located in prime agricultural growing regions. Several bankers also commented that they do not expect loan repayment rates to improve unless crop prices increase.
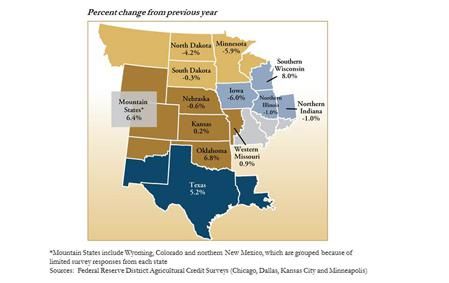
Farmland values moderated in most agricultural production states due to falling crop prices. In the first quarter of 2015, farmland values declined in states throughout the Corn Belt, and changes in farmland values continued to vary across states (Map). Farmland value declines were largest in Iowa and Minnesota, while some states continued to post modest increases relative to the same quarter a year ago.
Map: Value of Nonirrigated Cropland, First Quarter 2015
The views expressed are those of the authors and do not necessarily reflect the positions of the Federal Reserve Bank of Kansas City or the Federal Reserve System.
Authors

Cortney Cowley
Assistant Vice President and Oklahoma City Branch Executive