Chart 11: Farm Debt Outstanding at Commercial Banks
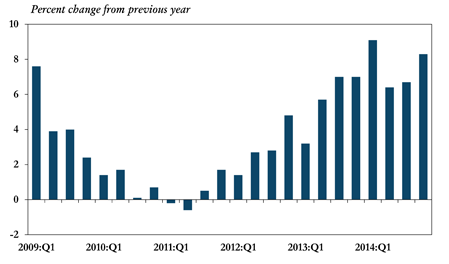
Chart 12: Rate of Return on Assets, Fourth Quarter 2014
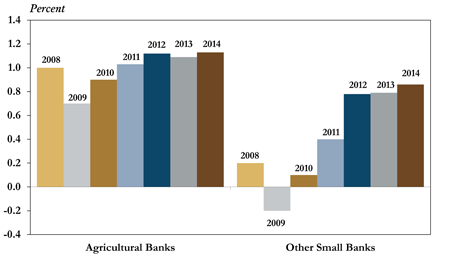
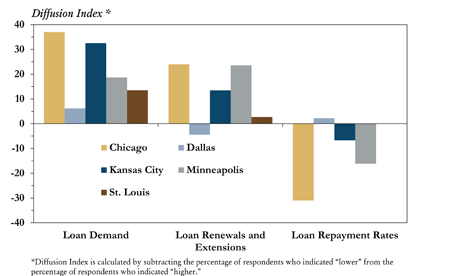
Chart 13: Selected Agricultural Credit Conditions, Fourth Quarter 2014
Map: Value of Nonirrigated Cropland, Fourth Quarter 2014
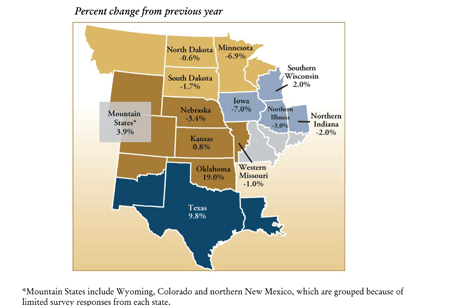
Chart 1: Non-Real Estate Farm Loan Volumes by Purpose
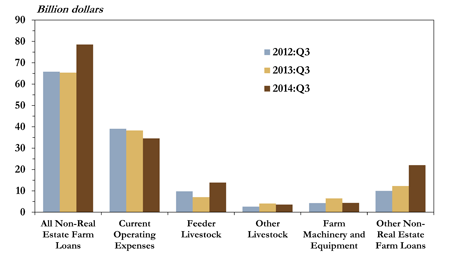
Chart 2: Current Operating Loan Volume
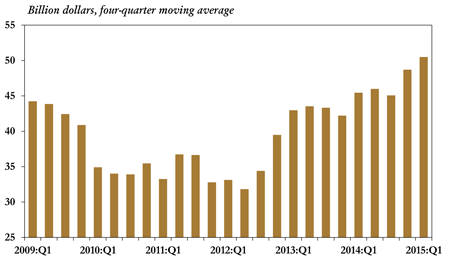
Chart 3: U.S. Corn and Soybean Prices
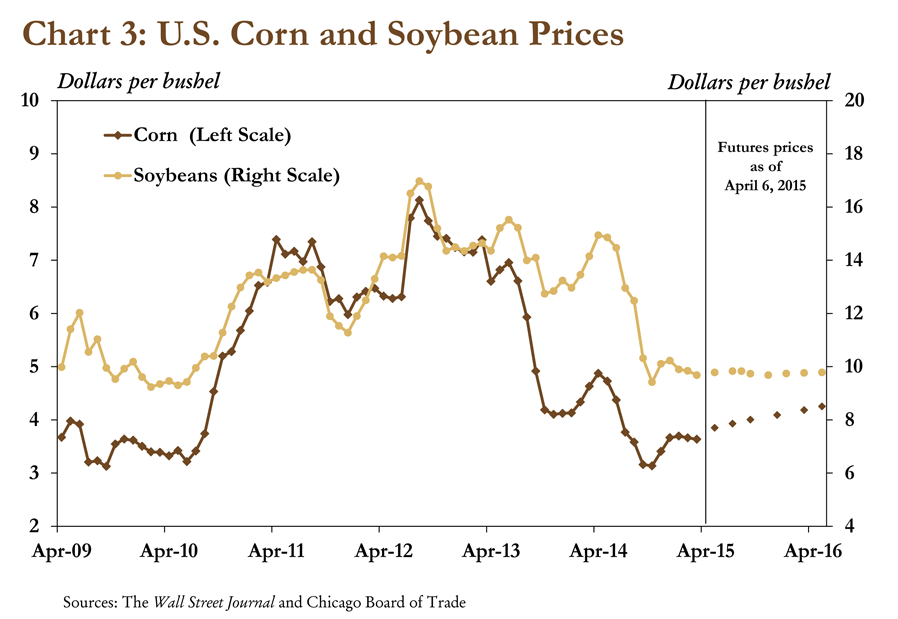
Chart 4: U.S. Crop Cash Receipts and Input Costs
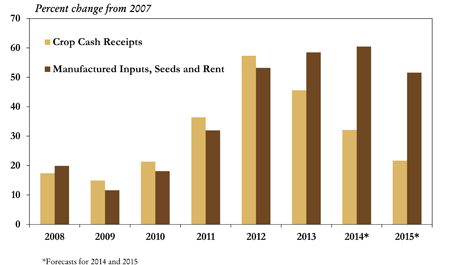
Chart 5: Livestock Loan Volume and Feeder Cattle Price
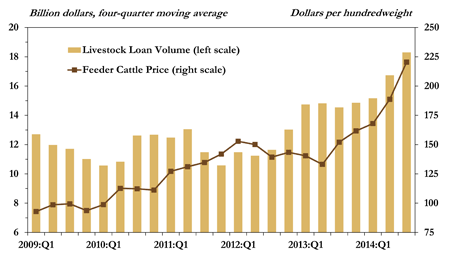
Chart 6: Hog Inventory and Price
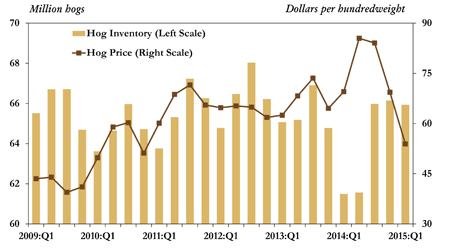
Chart 7: Shares of Non-Real Estate Bank Loans with Floating and Fixed Interest Rates Made to Farmers
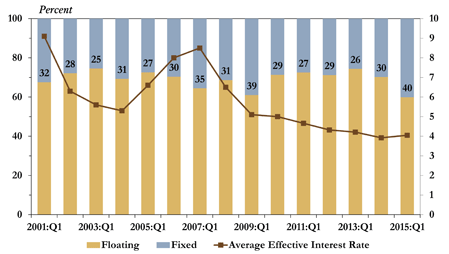
Chart 8: Shares of Non-Real Estate Farm Loans with Fixed Interest Rates by Purpose
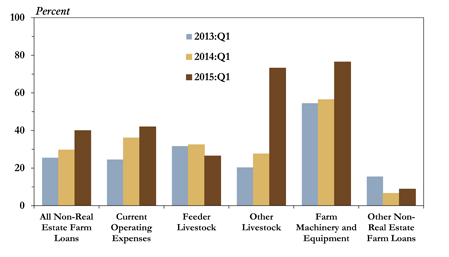
Chart 9: Delinquency Rates on Farm Loans
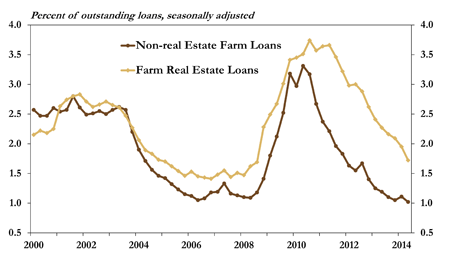
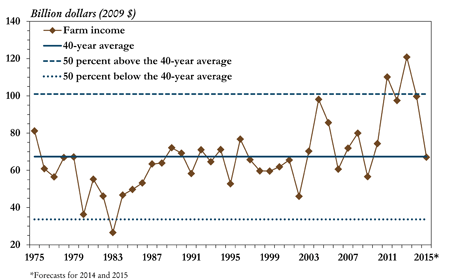
Chart 10: Real Net Farm Income
Conclusion
As profit margins on farms tightened, producers borrowed more and reduced capital spending in late 2014 and early 2015. However, farm income has yet to fall below long-term historical averages, and recent data have shown only minimal declines in credit conditions. Relatively strong credit conditions have been partially supported by extraordinary profits among crop producers the last several years and, more recently, record profits for cow/calf producers. If the declining trend in farm income persists, however, agricultural credit conditions could weaken more noticeably in the future.
Commercial bank call report data showed that farm sector lending at commercial banks has, in fact, continued to rise and profitability at both agricultural and other small banks has remained relatively strong. In the fourth quarter of 2014, farm debt outstanding at commercial banks grew 8.3 percent from 2013 (Chart 11). Loan growth was driven by a 6.8 percent increase in the volume of loans secured by farm real estate and a 9.9 percent increase in the volume of loans to finance agricultural production. At the same time, the percentage of nonperforming farm loans and net charge-offs declined. Improved farm sector loan performance supported a slight rise in profits at agricultural banks. At the end of the fourth quarter, the return on assets at banks with an above-average share of loans made to the agricultural sector rose from 1.09 percent in 2013 to 1.13 percent in 2014 (Chart 12).
Depressed farm incomes have begun to put downward pressure on farmland values, particularly in areas devoted to crop production. Farmland values declined in states throughout the Corn Belt due to lower crop prices, while values rose in states relatively more dependent on cattle, oil and natural gas production (Map). In the Dallas Federal Reserve District for example, farmland values strengthened for all types of farmland, while dryland and irrigated farmland values declined or increased at a slower rate in the Minneapolis and Kansas City Districts. Ranchland values continued to climb in all districts, as feeder cattle prices supported strong profit margins for cow/calf operations. As demand remained high and supply became more limited for good-quality land, the range of prices between good and marginal land also increased. A majority of survey respondents, however, expected farmland values to remain steady or decline in 2015.
Livestock loan volumes increased in the first quarter of 2015 as profit margins in the cattle sector reacted to another quarter of strong prices for feeder cattle. Profit margins tightened for feedlot operators, while cow/calf producers experienced better margins due to high cattle prices and low feed costs. Lending for feeder livestock increased more than 20 percent as producers rebuilt their herds and feedlot operators dealt with increasing costs (Chart 5). Following several years of herd liquidation, in 2014, cattle operations switched from liquidation to expansion and the U.S. cattle herd grew by 2.1 percent. As cattle inventories rebounded slightly, feeder cattle prices softened in the first quarter of 2015 but remained historically high. High feeder cattle prices continued to sustain livestock loan volumes but could moderate.
In the hog sector, loan volumes rose as declining hog prices resulted in reduced profit margins. The drop in hog prices over the last two quarters was primarily the result of a growing U.S. hog herd. Hog inventories began rebounding in the second half of 2014, following massive reductions during the porcine epidemic diarrhea virus outbreak (Chart 6). Since June 2014, hog prices have dropped 40 percent, causing hog producers to depend more on lending to maintain inventories and cover operating expenses.
Although farm sector lending has continued to rise, the share of farm loans made with fixed interest rates increased notably in the first quarter of 2015. Between the first quarters of 2013 and 2015, the share of all non-real estate farm loans with fixed interest rates rose from 26 percent to 40 percent, respectively (Chart 7). This shift from floating to fixed interest rates was most pronounced for livestock loans, excluding feeder livestock, and farm machinery and equipment loans (Chart 8). Interest rates on non-real estate farm loans increased modestly in the first quarter of 2015, after declining steadily since 2007, and this uptick could have prompted more farmers to further “lock-in” at historically low rates.
Section A - First Quarter National Farm Loan Data
Agricultural lending continued to grow in the first quarter of 2015. The national Survey of Terms of Bank Lending to Farmers, conducted during the first full week of February, indicated the total volume of non-real estate farm loans was $8.1 billion more than in the same period in 2014 (Chart 1). Overall growth in loan volume was driven by increased borrowing for current operating expenses and livestock purchases. Current operating loan volumes grew for the third year in a row following several quarters of depressed crop prices (Charts 2 and 3). Demand for operating loans could remain elevated as futures markets for fall crops show prices are expected to remain low due to the possibility of another record harvest.
The USDA projected plantings report showed soybean acreage could rise to record levels in 2015. Corn acreage was expected to decline for the third consecutive year, but the corn crop was still projected to be the third largest in history. As in 2014, large corn and soybean harvests could keep crop prices comparatively low, which would further weaken cash receipts for fall crops (Chart 4). This year, input costs were expected to decline less than crop cash receipts, which could put additional downward pressure on farm income and further increase the need for financing to cover expenses.
Section B - Fourth Quarter Call Report Data
Despite declines in farm income over the last several quarters, delinquency rates on both farm real estate and non-real estate loans declined in late 2014 (Chart 9). Although incomes have dropped substantially from recent highs, they were not yet expected to fall below the average of the past 40 years (Chart 10). In addition, extremely low incomes (i.e., 50 percent below the long-run average) have not been observed since 1983 and, in the four years prior to 2015, incomes were extraordinarily high. Multiple years of historically high incomes helped strengthen balance sheets and better prepare producers for the effects of declining prices seen more recently. As a result of borrowers’ strong financial positions, credit conditions have remained solid, even as debt in the farm sector has increased.
Section C - Fourth Quarter Regional Agricultural Data
Although loan delinquency rates remain low, Federal Reserve District agricultural survey data showed slight deteriorations in some credit conditions across some regions. In most districts, demand for operating loans increased, loan repayment rates declined and more requests were made for loan renewals and extensions (Chart 13). Declines in farm income also pushed down household and capital spending in all districts. Survey respondents indicated that funds were available for farm loans but noted a slight increase in collateral requirements. Looking ahead, bankers in the Chicago and Dallas Federal Reserve Districts expected lending to increase for cattle and operating expenses next quarter, while loan volume was expected to decrease for crop storage and farm machinery.
The views expressed are those of the authors and do not necessarily reflect the positions of the Federal Reserve Bank of Kansas City or the Federal Reserve System.
Author
