Sentiment about the 2017 outlook for agriculture has varied somewhat by scale and commodity. Nationally, the forecast for farm income suggested the downturn in the agricultural industry would continue in 2017. However, the forecast for cash income called for a slight increase, providing a somewhat more optimistic perspective for some parts of the industry. In the crop sector, above-trend yields have been a common and persistent theme in the last four years, and long-term price projections for major commodity crops have declined. In 2017, production and consumption could fall for all crops except soybeans. Inventories, however, generally are expected to remain elevated, which could keep prices low and weigh on agricultural finance conditions.
Farm Income and Commodity Revenues
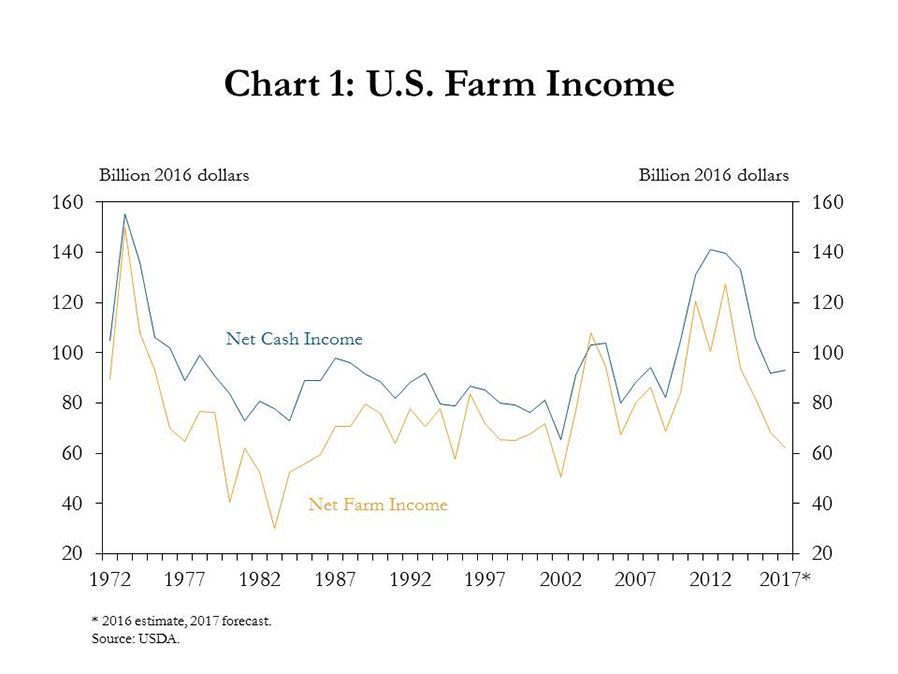
Income forecasts in 2017 have provided somewhat differing views of the agricultural outlook. The U.S. Department of Agriculture (USDA), for example, expected farm income to decline by about 8 percent from 2016, continuing declines from previous years. Cash income, however, was forecast to increase slightly (Chart 1). The two measures differ in that the calculation for farm income includes an adjustment for changes in farmers’ inventories, which is difficult to predict. Therefore, the slightly higher expectation for cash income has generated some optimism nationally because it breaks the trend of steep declines that has persisted since 2013.
Although cash income was forecast to increase slightly, the outlook for some commodities was more pessimistic. Little change overall was expected in crop and livestock revenues from 2016, but some large changes were anticipated for individual commodities. For example, cattle revenues were forecast to drop 7 percent, following a sharper decline in 2016 (Chart 2, left panel). In the crop sector, only soybean revenues were expected to remain relatively flat, following large gains in 2016 (Chart 2, right panel). Among other crops, a forecast decline for wheat revenues of 17 percent would be the largest downward change for an individual crop in 2017.

Historical Yields and Longer-term Price Projections
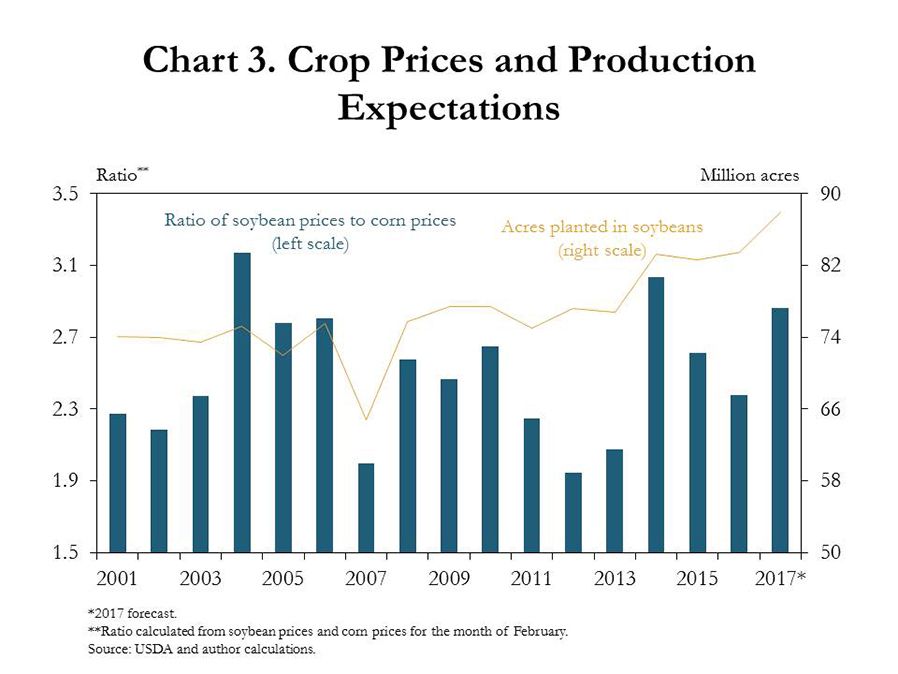
Despite disparity among commodity revenues, the national outlook for 2017 largely has depended on production of major commodity crops. One factor that affects production is the number of acres planted per crop. For 2017, the USDA forecasted a decline in the total number of acres planted for most crops.i However, the ratio of soybean prices to corn prices has driven expectations for an increase in acres planted in soybeans (Chart 3). Through most of February, the average soybean price was nearly three times larger than the average corn price, producing the third-largest relative price ratio between soybeans and corn in almost three decades. Since 2001, an increase in this price ratio has corresponded to an increase in acres planted in soybeans. Similarly, the USDA forecasted a 5 percent increase in soybean acres in 2017, while corn acreage was expected to decline 4 percent.
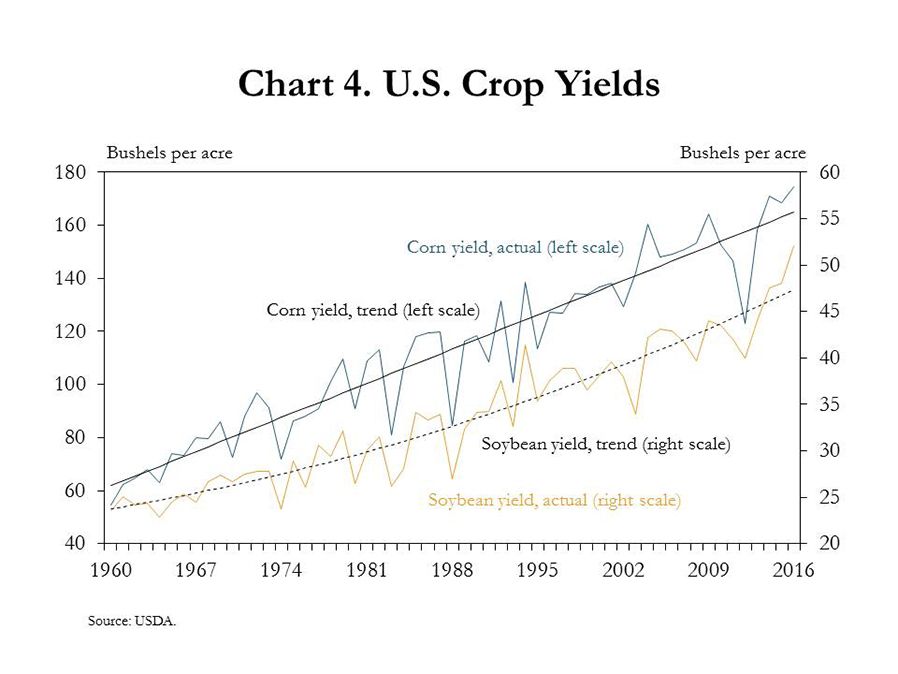
In addition to planted area, yields are expected to affect the size of the 2017 crop. U.S. average yields in corn and soybeans have trended higher since 1960, but actual annual yields have varied significantly (Chart 4).ii Over time, the average yield has been above trend yield in a majority of years. Because trend yield assumes normal weather, deviations were larger in years with below-trend yields, on average, than in the more frequent years of above-trend yields. However, respective corn, soybean and wheat yields in 2016 were 6, 10 and 12 percent above trend, which collectively was the largest above-trend deviation since 1960.
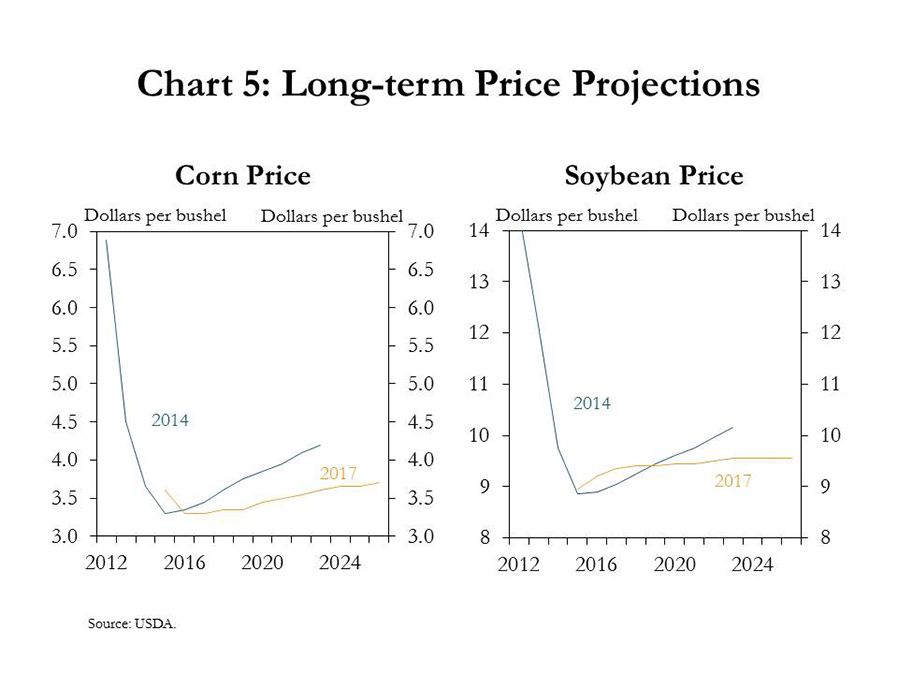
Expanded production has put downward pressure on longer-term price projections. Prices for both corn and soybeans have fallen significantly since 2012 (Chart 5). The expected longer-term path of corn and soybean prices also was higher and steeper in 2014 than in the most recent USDA projections made in February. Although corn prices were expected to increase slightly over the next decade, the path of prices has shifted downward from 2014 expectations.iii For soybeans, price forecasts for 2017 and 2018 were higher than in 2014, but after 2018, prices were expected to level off, breaking from the upward trend predicted in 2014.
Looking Ahead: Crop Inventories and Agricultural Finance
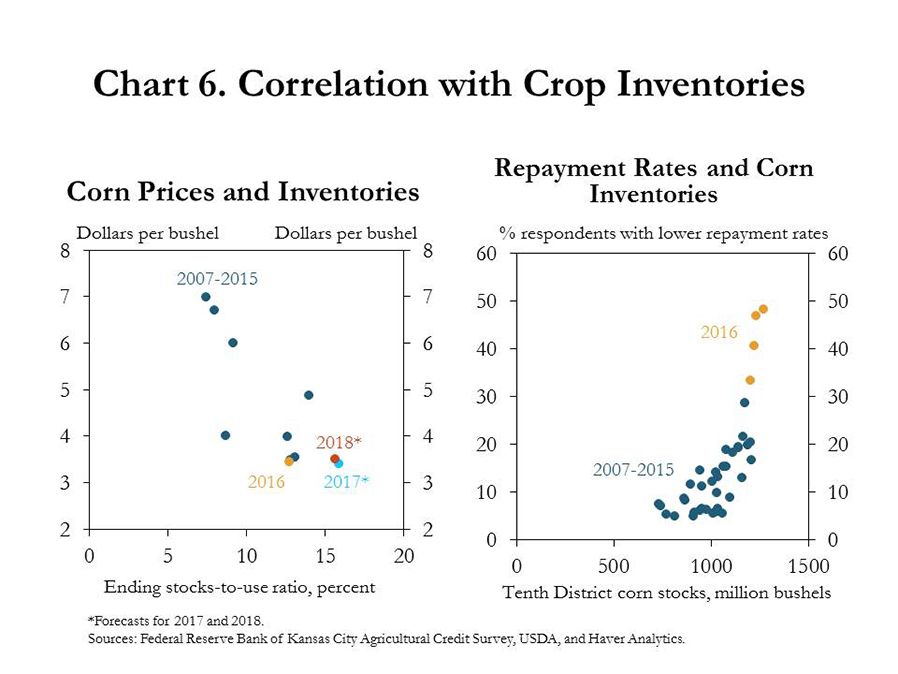
Increasing production for most commodities also has contributed to record-large inventories. Larger inventories are concerning because they typically are associated with lower prices. For example, corn prices and inventories have been highly correlated since 2007 (Chart 6, left panel). In addition, inventories in 2017 and 2018 could continue to expand, and corn prices for 2017 and 2018 are expected to remain below prices from previous years.
Elevated inventories also were correlated with lower repayment rates at agricultural banks. Specifically, producers seemed to be selling commodities to make loan payments but otherwise storing commodities and hoping for better prices later. Accordingly, a high, positive correlation has developed between corn stocks in the Tenth District and the percent of bankers who reported lower repayment rates (Chart 6, right panel). On a positive note, despite the correlation between elevated corn stocks and lower repayment rates, producers still have grain to sell. Additionally, the significant volume of stored commodities may explain why farm loan delinquencies have not risen substantially, even as loan repayment rates have fallen sharply.
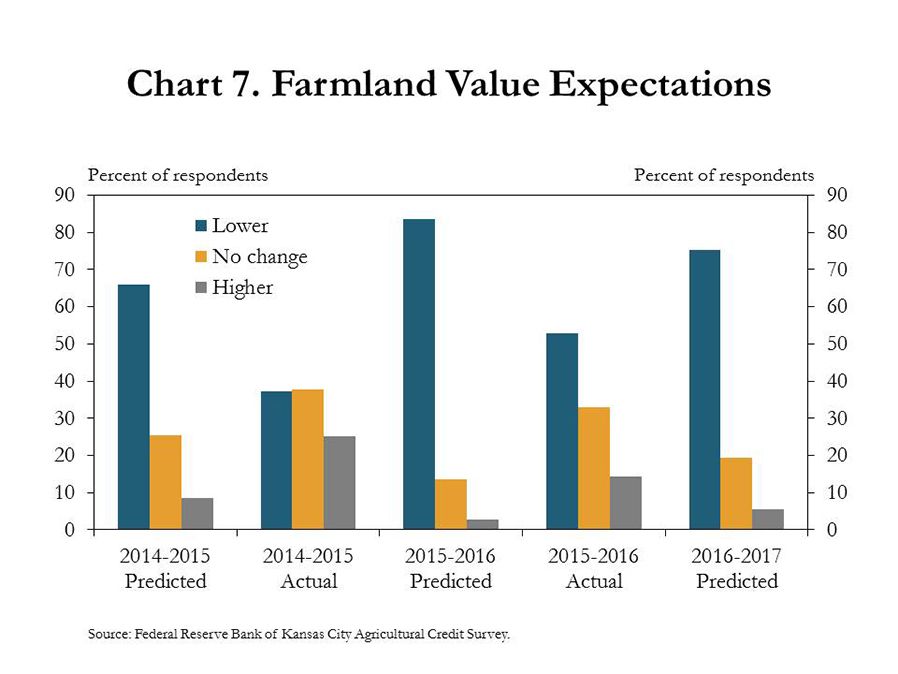
Another factor helping keep delinquency rates low is relative stability in farmland values despite expectations of further declines. Recent declines in farmland values have not been as sharp as expected (Chart 7), giving bankers more options for restructuring and/or extending loans. However, if the agricultural economy continues to slip, the persistent expectation of lower farmland values, which carried into the fourth quarter of 2016, becomes a larger concern.
Conclusion
Although sentiments associated with income and revenues may differ, the agricultural outlook for 2017 remains a continuation of the decline experienced in 2016. Large aggregate production over the last four years has put downward pressure on short- and longer-term price projections. In 2014, long-term projections for the path of prices were expected to be significantly lower than in 2012 and 2013, but the 2017 projections show that expectations have declined even further. If large supplies of agricultural products remain the recurring theme across all industries in 2017, prices likely will stay below more profitable levels, adding additional pressure to agricultural finance and credit conditions.
References:
i Johansson, Robert. 2017. “The Outlook for U.S. Agriculture.” Presented at the USDA Agricultural Outlook Forum. February 25. Available at External Linkhttps://www.usda.gov/oce/forum/2017_Speeches/Johansson_Outlook_2017_Speech.pdf.
ii Irwin, S., and D. Good. 2016. “Forming Expectations for the 2016 U.S. Average Corn Yield: What About El Niño?” farmdoc daily (6):41, Department of Agricultural and Consumer Economics, University of Illinois at Urbana-Champaign, March 2. Available at External Linkhttp://farmdocdaily.illinois.edu/2016/03/expectations-for-2016-us-average-corn-yield.html.
iii Office of the Chief Economist, World Agricultural Outlook Board, and U.S. Department of Agriculture. 2017. “USDA Agricultural Projections to 2026.” Prepared by the Interagency Agricultural Projections Committee. Long-term Projections Report OCE-2017-1, 106 pp. Available at External Linkhttps://www.usda.gov/oce/commodity/projections/.