Despite gradual deterioration in farm financial conditions over the past year, agricultural real estate values in the Tenth Federal Reserve District remained strong in 2025. According to survey respondents, farm income declined at a pace similar to the past year and liquidity was tight for a large share of borrowers. Despite softer farm finances, the value of cropland in the region was nearly unchanged from a year ago and ranchland values increased modestly. Land markets were stable alongside steady sales volume and firm demand and strong valuations continued to provide support for the sector.
The outlook for the U.S. farm economy remained subdued alongside weakness in the crop sector, but aggregate farm financial stress remained limited. Demand for farm loans has grown alongside tighter working capital, elevated production costs and a surge in cattle prices. Direct government payments and resilient farm real estate values have eased some of the strain from weak profitability for crop producers and strength in the cattle sector has lifted incomes in many areas. Farm loan delinquency rates have remained low despite increasing slightly in recent months but persistent weakness in the crop sector could weigh further on agricultural credit conditions.
Section 1: Farm Income and Credit Conditions
Farm income and liquidity deteriorated gradually through the end of 2025. The pace of decline in farm borrower income and liquidity in the Tenth District was similar to the past year (Chart 1). The share of lenders reporting that farm income was lower than the same time a year ago dropped slightly compared with last year in all states except Oklahoma and the Mountain states.
Chart 1: Tenth District Farm Income and Borrower Liquidity
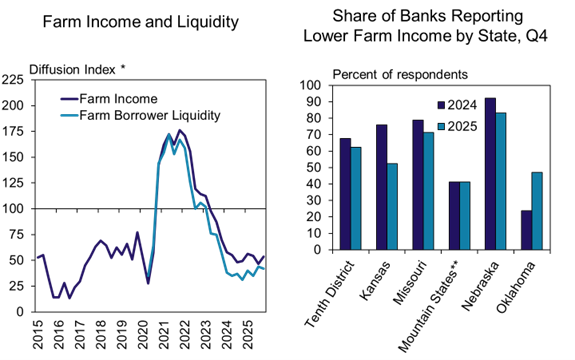
*The index numbers are computed by subtracting the percentage of respondents who responded "lower" from the percentage who responded "higher" and adding 100.
** Mountain States include Colorado, northern New Mexico and Wyoming.
A sizeable portion of farm borrowers had liquidity positions that signal modest financial challenges. On average, lenders in the region reported that about 45% of farm borrowers had current ratios below 1.5 (Chart 2). Liquidity has tightened alongside compressed margins among row crop producers, but current ratios also remained strong for a portion of borrowers.
Chart 2: Distribution of Farm Borrower Current Ratios, Q4 2025
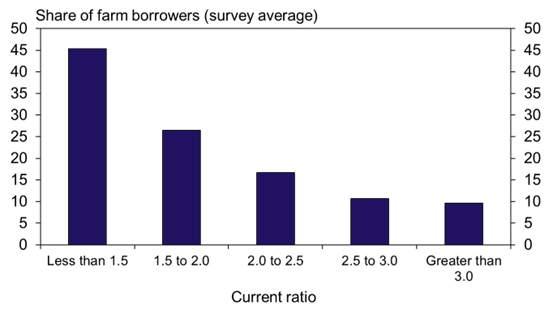
Note: Respondents were asked the following question - What percentage of your farm borrowers have a current ratio (current assets divided by current liabilities) within the following ranges (less than 1.5, 15. to 2.0, 2.0 to 2.5, 2.5 to 3.0, greater than 3.0)?
Tighter farm finances continued to weigh on credit conditions, but the pace of deterioration decelerated in the fourth quarter. The pace of decline in farm loan repayment rates slowed following several quarters of gradually faster deterioration (Chart 3). The share of lenders reporting that loan repayment was lower than the same time a year ago dropped considerably in all states except Oklahoma and the Mountain States.
Chart 3: Tenth District Farm Loan Repayment Rates
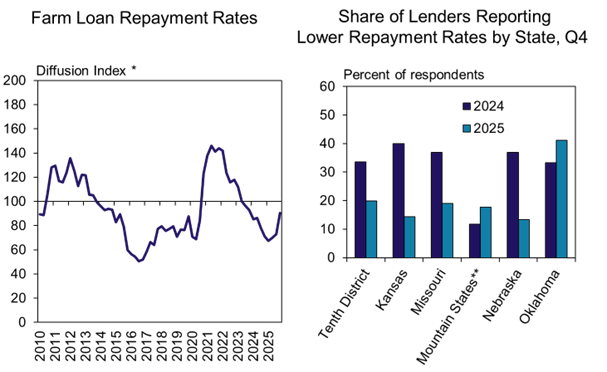
*The index numbers are computed by subtracting the percentage of respondents who responded "lower" from the percentage who responded "higher" and adding 100.
** Mountain States include Colorado, northern New Mexico and Wyoming.
Farm loan demand remained strong through the end of the year alongside reduced liquidity. Demand for non-real estate farm loans in the region increased at the fastest pace in about ten years (Chart 4). The share of lenders reporting that demand was higher than the same time a year ago increased considerably in Missouri and Oklahoma.
Chart 4: Tenth District Farm Loan Demand
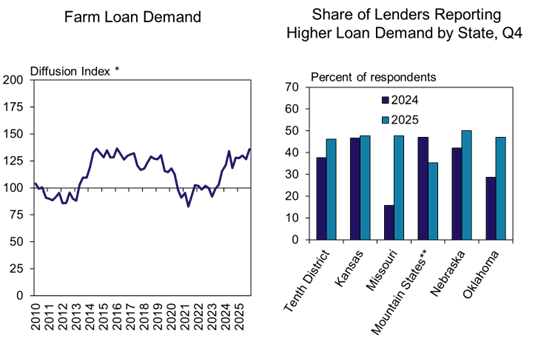
*The index numbers are computed by subtracting the percentage of respondents who responded "lower" from the percentage who responded "higher" and adding 100.
** Mountain States include Colorado, northern New Mexico and Wyoming.
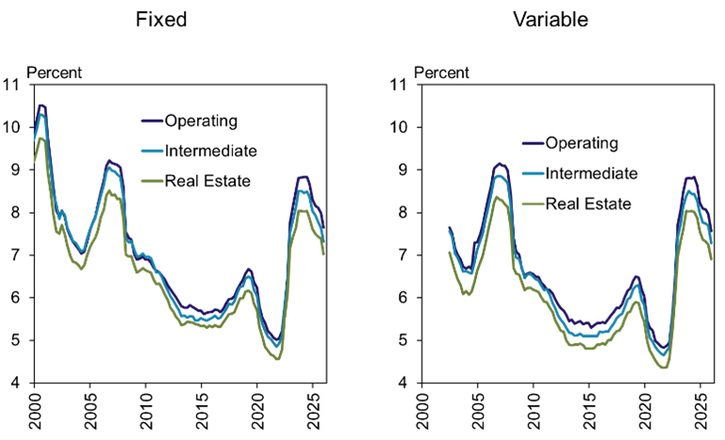
Interest rates on farm loans declined in the fourth quarter but remained elevated compared with recent decades. The average rate on all types of farm loans dropped by an average of 35 basis points since the previous quarter but remained about 80 basis points above the 20-year average (Chart 5). The combination of higher debt balances and the current level of interest rates has increased financing costs and has likely been particularly challenging for highly leveraged operations.
Chart 5: Average Farm Loan Interest Rates
Section 2: Farmland Markets and Interest Rates
Farmland markets softened in 2025 alongside gradual deterioration in farm finances and the modestly elevated interest rates, but values remained strong. The value of irrigated and non-irrigated cropland in the region changed by about 1% from a year ago (Chart 6). Ranchland values increased modestly over the past year alongside strength in the cattle sector and reached record levels.
Chart 6: Tenth District Farmland Values
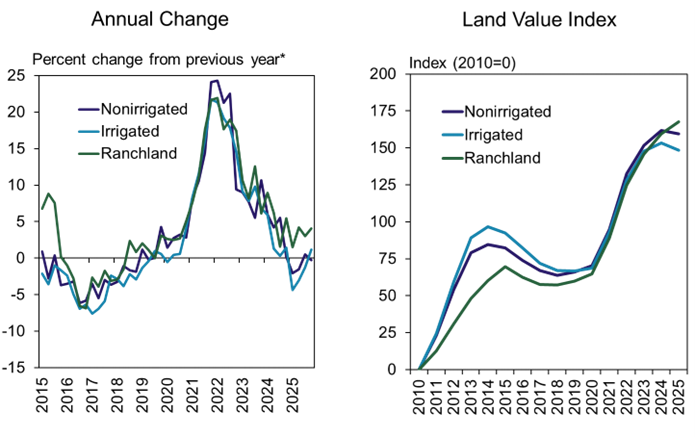
*Percent changes are calculated using responses only from lenders reporting in both the past and the current quarters.
While cropland values remained broadly stable across the District, strength in the cattle sector likely supported values in some areas. Cropland and ranchland values increased comparatively more in Oklahoma and the Mountain states where farm revenues are more dependent on cattle. (Table 1). In more crop-intensive states like Kansas, Missouri and Nebraska, cropland values declined slightly.
Table: Tenth District Farmland Values by State, 2025 Average
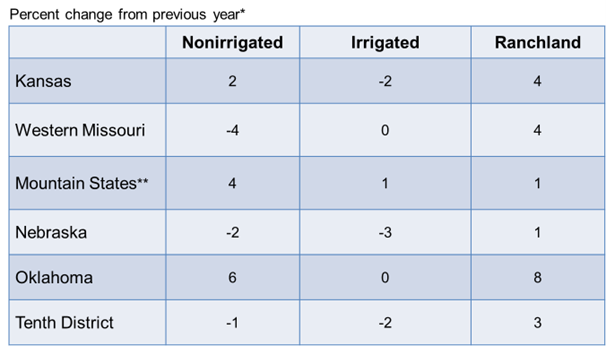
* Percent changes are calculated using responses only from lenders reporting in both the past and the current quarters.
** Mountain States include Colorado, northern New Mexico and Wyoming.
The volume of farmland sales and overall demand were steady despite a slight retreat in farmer demand alongside tighter farm financial conditions. According to lenders, sales volumes were generally stable compared with last year and overall demand was also similar (Chart 7). Farmers remained the primary buyers, but the share of land they purchased declined to slightly less than 75%, on average, which was the lowest level since 2011.
Chart 7: Volume of Farmland Sales and Share Purchased by Farmers, Q4
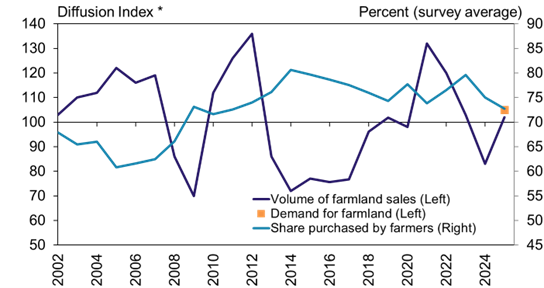
*The index numbers are computed by subtracting the percentage of bankers who responded "lower" from the percentage who responded "higher“ and adding 100.
Note: Respondents were asked the following questions - How does the volume of farmland sales this year compare to last year in your area (increased, decreased, or remained the same)? How does demand for farmland this year compare to last year in your area (increased, decreased, or remained the same)? Of the farmland sold this year, what share was purchased by farmers?
Demand for farmland was steady or slightly higher in most states while sales volumes declined in some areas. Responses from lenders indicated unchanged or slightly higher demand for land in all states (Chart 8). The volume of transactions was notably lower than the previous year in Oklahoma while sales were notably higher in Missouri.
Chart 8: Volume of Farmland Sales and Demand for Farmland by State, Q4 2025
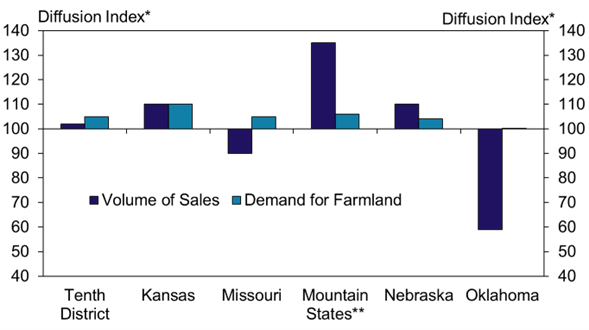
*The index numbers are computed by subtracting the percentage of bankers who responded "lower" from the percentage who responded "higher“ and adding 100.
**Mountain States include Colorado, northern New Mexico and Wyoming, which are grouped because of limited survey responses from each state.
Note: Respondents were asked the following questions - How does the volume of farmland sales this year compare to last year in your area (increased, decreased, or remained the same)? How does demand for farmland this year compare to last year in your area (increased, decreased, or remained the same)?
Cash rents for cropland declined slightly in the fourth quarter while ranchland rents increased. Rental rates on irrigated and nonirrgated cropland decreased about 3% and 2% from a year ago, respectively (Chart 9). Similar to ranchland values, cash rents for grazing increased about 3%.
Chart 9: Tenth District Cash Rents
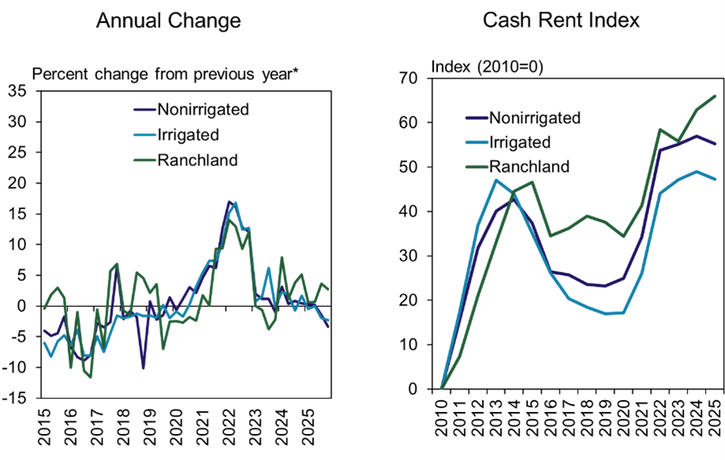
*Percent changes are calculated using responses only from lenders reporting in both the past and the current quarters.
The expected rate of return on farmland declined alongside steady valuations and lower cash rents, but cropland remained desirable relative to alternative investments when inflation is considered. The capitalization rate of nonirrigated farmland (cash rents divided by land values) has been around 150 basis points below the yield on long term U.S. bonds since late 2023 but remained about 75 basis points above the yield on inflation protected securities (Chart 10). While farm financial conditions continue to influence demand for agricultural land, this relationship could signal that returns earned through cash rents remain attractive in the current interest rate environment.
Chart 10: Tenth District Farmland Capitalization Rate and Yields on U.S. Government Securities
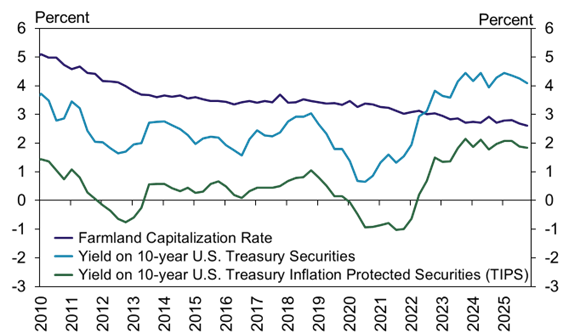
Note: The capitalization rate is calculated as cash rent on nonirrigated farmland divided by the value of nonirrigated farmland.
Source: Federal Reserve Board and Haver Analytics
Banker Comments Q4 2025
“It is early in our renewal season; however, it looks like there will be some refinances this year.”
“Profits from livestock producers have helped maintain income levels for those making capital purchases.”
“Crop producers are struggling while livestock is flourishing. Government payments have helped, but not enough to save some producers.”
“….low [prices in crop] futures markets along with 30-40 cents lower basis than normal have put a big strain on all farmers’ cash flows.”
“….land costs remain high, but it's a strong asset for borrowers and families.”
“Government payments will do little but blunt the impact of low prices and high costs.”
“Several row croppers are finding ways to partner with beef producers in custom grazing wheat or purchasing beef animals to graze wheat and/or feed low priced corn.”
“Farmers are breaking even to making some money.”
“Thus far into renewals, we're finding that working capital deterioration isn't as widespread as we would have expected throughout the year.”
“Yields in our area offset losses elsewhere in the operations and cattle were the bright spot in 2025 for our producers.”
“Grain prices have really hurt cash flows along with higher input cost.”
“Crop farmers in the area are having an abnormally high yields while still slowly losing working capital due to poor cash flows.”
A total of 106 lenders responded to the Fourth Quarter Survey of Agricultural Credit Conditions in the Tenth Federal Reserve District—an area that includes Colorado, Kansas, Nebraska, Oklahoma, Wyoming, the northern half of New Mexico and the western third of Missouri. Please refer questions to Ty Kreitman at 1-800-333-1040.
The views expressed are those of the authors and do not necessarily reflect the positions of the Federal Reserve Bank of Kansas City or the Federal Reserve System.
Authors

Ty Kreitman
Associate Economist