Small business commercial & industrial (C&I) loan balances decreased by 18.6 percent compared with the third quarter of 2020. The decline coincided with a continuing decrease in the percentage of loans guaranteed by the Small Business Administration (SBA) related to ongoing forgiveness of Paycheck Protection Program (PPP) loans to small businesses. New small business lending increased by nearly 10 percent when compared with the third quarter of 2020, driven by a 40.9 percent increase in new lines of credit. The 123 survey respondents indicated increased loan demand along with rising interest rates. Respondents also reported increased credit line usage for the first time since the onset of the pandemic in the second quarter of 2020. Overall, survey responses indicated improving credit quality but declining loan application approval rates.
Chart 1: PPP Forgiveness Drives Decrease in Outstanding Small Business Loan Balances
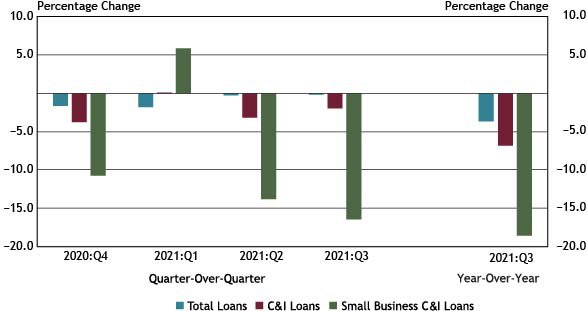
Note: Items are calculated using a subset of 86 respondents that completed the FR 2028D for the last five quarters surveyed.
Sources: Call Report, schedule RC-C Part I, items 4. Commercial and Industrial Loans and 12. Total loans and leases held for investment and held for sale; FR 2028D, items 4.b and 5.c.; and External LinkSBA PPP Forgiveness Platform Lender Submission Metrics.
Outstanding small business C&I loan balances decreased 16.4 percent quarter-over-quarter and 18.6 percent year-over-year. The decline in small business loan balances is likely attributed to the expiration of the PPP and an increase in PPP loan forgiveness payments. According to the SBA, PPP loan forgiveness stood at 70 percent of total outstanding loans as of September 26, 2021. Total loans and total C&I loans declined by 3.6 percent and 6.8 percent, respectively, when compared with the third quarter of 2020.
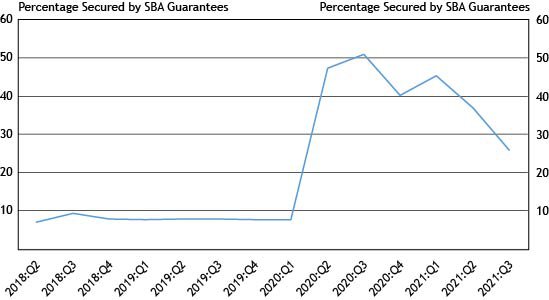
Chart 2: Outstanding Loans Guaranteed by the SBA Continue Sharp Decline
Source: FR 2028D, Special Question.
Outstanding small business loan balances guaranteed by the SBA continue to decline due to PPP loan forgiveness but remain higher than before the start of the pandemic. In the third quarter of 2021, outstanding small business loan balances guaranteed by the SBA declined to 26 percent, which is 11 points lower than the previous quarter. Pre-pandemic, balances guaranteed by the SBA had remained steady at approximately 8 percent since the second quarter of 2018.
Chart 3: Small Business Credit Line Balances Increase Substantially
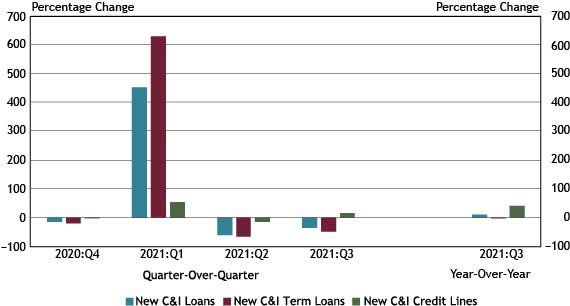
Note: Items are calculated using a subset of 86 respondents that completed the FR 2028D for the last five quarters surveyed. All loan types referenced in Chart 3 refer to small business lending.
Source: FR 2028D, items 7.b and 8.c.
New small business C&I lending increased 9.8 percent in the third quarter compared with the previous year, driven by a 40.9 percent increase in lines of credit. The increase in new lines of credit may be attributable to a shift in small business financing from term loans to credit lines offering comparable rates after the expiration of the term-based PPP. Quarter-over-quarter, new small business lending decreased 37 percent, driven by a reduction in term loans.
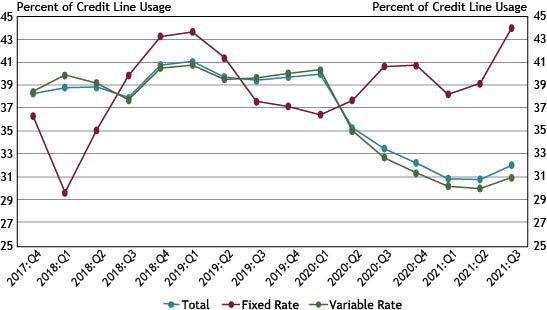
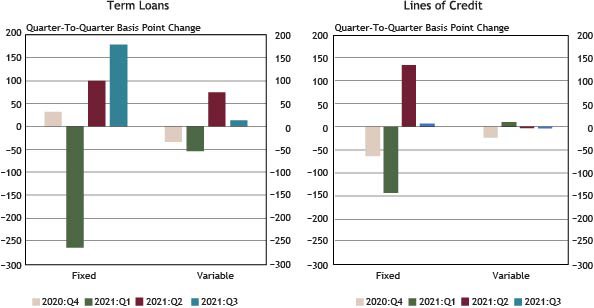
Chart 4: Credit Line Usage Increases for the First Time Since First Quarter of 2020
Source: FR 2028D, items 5.b and 5.c.
The use of fixed rate lines of credit increased from 39.2 percent in the second quarter to 44 percent in the third quarter of 2021. Variable rate lines of credit grew only slightly but accounted for 89 percent of total credit lines. This caused total credit line usage to increase to 32 percent in the third quarter, reversing a declining trend since the onset of the pandemic in the second quarter of 2020. The increase may be indicative of a normalizing use of credit lines following the end of the PPP.
Chart 5: Interest Rates Increase Across Most New Loan Categories
Note: Items are calculated using a subset of 86 respondents that completed the FR 2028D for the last five quarters surveyed.
Source: FR 2028D, items 7.c and 8.d.
The weighted average interest rate for most small business loan products increased or remained stable in the third quarter of 2021. The largest increase of 179 basis points was reported for fixed-rate term loans, consistent with the increases noted in the second quarter of 2021 as the PPP ended. Weighted average rates for new term lending will no longer include loans made through the PPP, which carried an interest rate of one percent.
Chart 6: New Term Loans Rates Higher Than New Lines of Credit
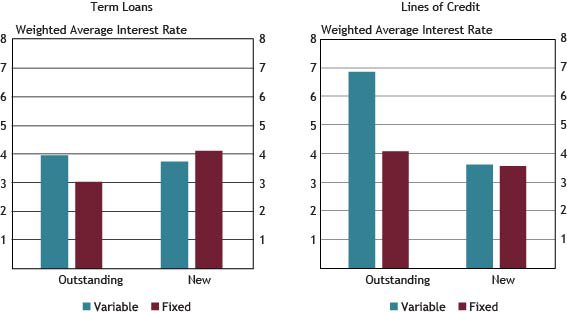
Note: Average interest rates are weighted by the dollar volume of new small business C&I loans.
Source: FR 2028D, items 4.c, 5.d, 7.c and 8.d.
Weighted average interest rates on small business lending ranged from 3.02 to 6.85 percent. The highest rate of 6.85 was reported for outstanding variable-rate lines of credit, and the lowest reported rate was 3.02 for outstanding fixed-rate term loans, which include PPP loans, booked at an interest rate of one percent.
Chart 7: New Small Business Loans with Interest Rate Floors Decrease Slightly
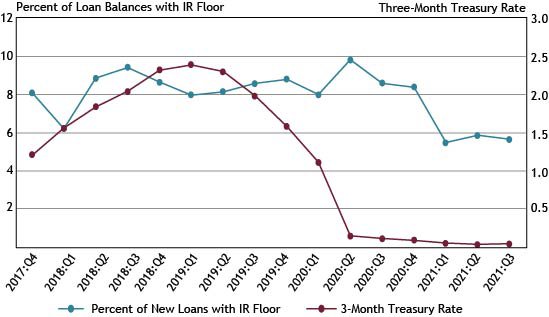
Source: FR 2028D, items 7.a, 7.f, 8.a and 8.e.; and Federal Reserve Bank of St. Louis, 3-Month Treasury Constant Maturity Rate
The percentage of new variable-rate small business loans with interest rate floors decreased slightly, from 5.9 percent to 5.6 percent in the third quarter. The percentage of loans with interest rate floors has trended down since its peak of 9.8 percent in the second quarter of 2020.
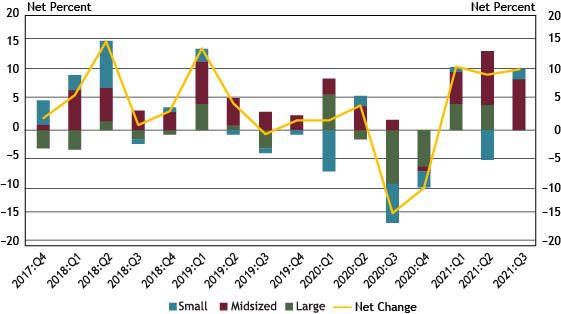
Chart 8: Increase in Credit Line Usage Driven by Midsized Banks
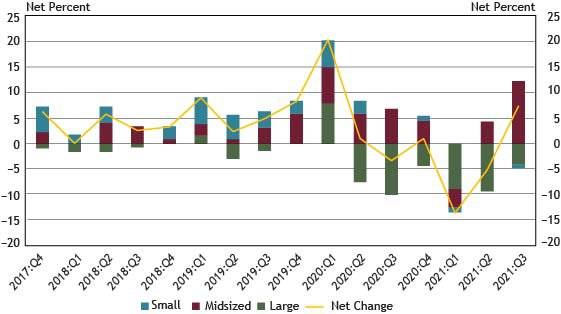
Notes: Chart 8 shows diffusion indexes for credit line usage. The diffusion indexes show the difference between the percent of banks reporting decreased credit line usage and those reporting increased credit line usage. Net percent refers to the percent of banks that reported having decreased (“decreased somewhat” or “decreased substantially”) minus the percent of banks that reported having increased (“increased somewhat” or “increased substantially”).*
Source: FR 2028D, items 11 and 12.
The percentage of respondents indicating a change in credit line usage, whether an increase or decrease, declined from 38 percent in the second quarter to 30 percent in the third quarter. On net, about 7 percent of respondents indicated an increase in credit line usage, primarily driven by midsized banks. This observation correlates with the increase in total credit line usage indicated in Chart 4. Of banks reporting a change in credit line usage, 41 percent cited changes in local or national economic conditions and changes in pricing as the very important reasons.
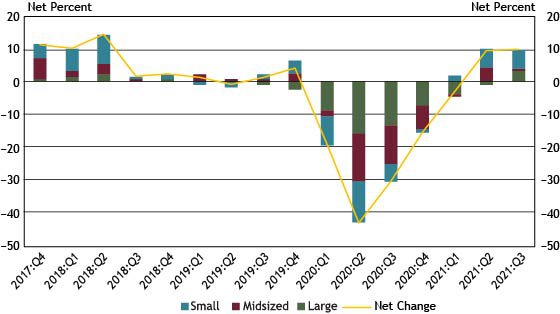
Chart 9: Respondents Report Stronger Loan Demand
Notes: Chart 9 shows diffusion indexes for loan demand. The diffusion indexes show the difference between the percent of banks reporting weakened loan demand and those reporting stronger loan demand. Net percent refers to the percent of banks that reported having weakened (“moderately weaker” or “substantially weaker”) minus the percent of banks that reported having stronger loan demand (“moderately stronger” or “substantially stronger”).
Source: FR 2028D, item 13.
In the third quarter, about 39 percent of respondents reported a change in loan demand. On net, about 8 percent of midsized banks indicated stronger loan demand, compared with about 2 percent of small banks. Overall, about 10 percent of respondents indicated stronger loan demand in the third quarter, which is the third consecutive quarter of net increases in loan demand.
Chart 10: Loan Approval Rates Decrease Substantially for Small Banks
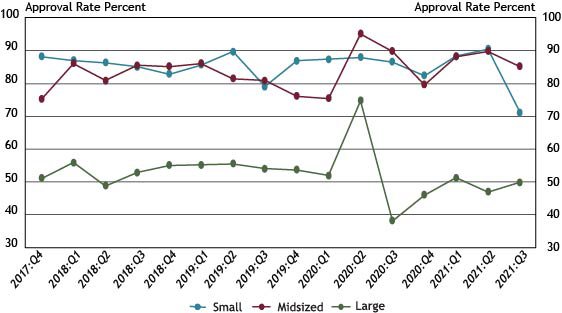
Source: FR 2028D, items 14.a and 15.
Small business lending approval rates at small banks decreased from 91 percent in the second quarter to 71 percent in the third quarter of 2021, the lowest level reported since the inception of the survey. Approval rates for midsized banks decreased from 90 percent to 85 percent during the same period, while approval rates at large banks increased from 47 percent to 50 percent. The three most cited reasons for denying a loan for all bank sizes were borrower financials, credit history and collateral.
Chart 11: Credit Quality Increases for the Second Consecutive Quarter
Notes: Chart 11 shows diffusion indexes for credit quality of applicants. The diffusion indexes show the difference between the percent of banks reporting a decline in credit quality and those reporting improvement in credit quality. Net percent refers to the percent of banks that reported declining credit quality (“declined somewhat” or “declined substantially”) minus the percent of banks that reported improving credit quality (“improved somewhat” or “improved substantially”).
Source: FR 2028D, items 20 and 21.
For the second consecutive quarter, about 10 percent of banks, on net, reported an increase in applicant credit quality. All three bank sizes reported a net increase, with small banks and large banks reporting 6 percent and 3 percent, respectively. Of respondents reporting a change in credit quality, whether an increase or decrease, 47 percent cited the debt-to-income level of commercial borrowers as a very important reason for change. Other commonly cited reasons for a change were the liquidity positions of borrowers and recent business income growth.
Chart 12: Banks Ease Credit Standards with Mixed Loan Terms
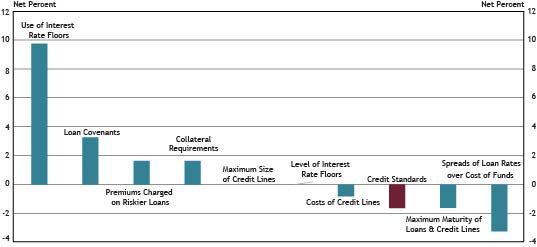
Note: Chart 12 shows diffusion indexes for credit standards (red bar) and various loan terms. The diffusion indexes show the difference between the percent of banks reporting tightening terms and those reporting easing terms. Net percent refers to the percent of banks that reported having tightened (“tightened somewhat” or “tightened considerably”) minus the percent of banks that reported having eased (“eased somewhat” or “eased considerably”).
Source: FR 2028D, items 16, 17, 18 and 19.
About 11 percent of respondents reported a change in credit standards in the third quarter of 2021, up about 2 percent from the second quarter. Of banks indicating a change in credit standards, 1.6 percent, on net, reported easing credit standards, compared with the 2.6 percent of respondents who reported tightening credit standards in the prior quarter.
Respondents also indicated varying loan terms with use of interest rate floors tightening the most, and spreads of loan rates over cost of funds easing the most in the third quarter. Respondents reporting tightening credit standards or loan terms in the third quarter cited a less favorable or more uncertain economic outlook, worsening industry-specific problems, and reduced tolerance for risk. Respondents reporting easing credit standards or loan terms in the third quarter cited more favorable or less uncertain economic outlook, improvement in industry specific problems and improvement in their current or expected liquidity positions.
Other contributors to the release include Nicholas Bloom, Dan Harbour, Thomas Hobson, Alli Jakubek, Stefan Jacewitz and Tony Walker.
*Small banks have total assets of $1 billion or less, midsized banks have total assets between $1 billion and $10 billion and large banks have total assets greater than $10 billion.
The views expressed are those of the authors and do not necessarily reflect the positions of the Federal Reserve Bank of Kansas City or the Federal Reserve System.
Author