Small business commercial and industrial (C&I)_ loan balances decreased compared to the second quarter of 2021, the last quarter of the Paycheck Protection Program (PPP). New small business loan balances decreased nearly 35 percent when compared to the previous year with outstanding balances declining by about 28 percent. On net, the 133 respondents to the survey indicated that credit standards and loan terms continued to tighten. All banks that indicated a change in credit standards reported tightened standards for the first time since the survey was implemented in the fourth quarter of 2017. Median rates for new term loans and lines of credit continue to rise, which is directly consistent with the continued rising rate environment. Further, respondents noted diminishing credit quality and overall weaker loan demand. About 41 percent of respondents indicated that supply chain disruptions impacted loan demand with about 26 percent indicating that disruptions increased demand.
Chart 1: Outstanding Small Business Loan Balances Decrease
Skip to data visualization tableNote: Items are calculated using a subset of 96 respondents that completed the FR 2028D for the last five quarters surveyed.
Sources: Call Report, Schedule RC-C Part I, items 4. Commercial and Industrial Loans and 12. Total Loans and Leases Held for Investment and Held for Sale, Small Business Administration, and FR 2028D, items 4.b and 5.c.
| Quarter-Over-Quarter | Total Loans | C&I Loans | Small Business C&I Loans |
|---|---|---|---|
| 2021:Q3 | -0.14 | -2.12 | -16.07 |
| 2021:Q4 | 5.23 | 7.71 | -4.36 |
| 2022:Q1 | 1.46 | 4.36 | -6.76 |
| 2022:Q2 | 4.64 | 5.6 | -4.34 |
| Year-Over-Year 2022:Q2 | 11.57 | 16.18 | -28.4 |
Small business loan balances decreased 4.3 percent quarter-over-quarter, the fifth consecutive quarter-over-quarter decline, and 28.4 percent year-over-year in the second quarter. The continued year-over-year decline in small business loan balances is partially attributable to the May 2021, expiration of the PPP and continuing forgiveness of PPP loans. According to the Small Business Administration, 94 percent of total PPP loan balances had been forgiven as of June 2022, a 4 percent increase since the first quarter of 2022. Despite the large year-over-year change in small business C&I loans, total loans and total C&I loans increased 11.6 percent and 16.2 percent, respectively.
Chart 2: New Small Business Loans Decrease Year-Over-Year
Skip to data visualization tableNote: Items are calculated using a subset of 96 respondents that completed the FR 2028D for the last five quarters surveyed. All loan types referenced in Chart 2 refer to small business lending.
Source: FR 2028D, items 7.b and 8.c.
| Quarter-Over-Quarter | New C&I Loans | New C&I Term Loans | New C&I Credit Lines |
|---|---|---|---|
| 2021:Q3 | -36.84 | -49.03 | 11.93 |
| 2021:Q4 | 5.14 | -1.04 | 16.4 |
| 2022:Q1 | -8.56 | -9.65 | -6.88 |
| 2022:Q2 | 7.3 | 16.27 | -6.18 |
| Year-Over-Year 2022:Q2 | -34.85 | -47 | 13.81 |
New small business loan balances decreased 34.8 percent compared with the previous year, driven by a 47 percent decrease in new term loans. Most of the decrease in new term loans is attributable to the expiration of the PPP program in May 2021, which had previously driven the high volumes of term loans. Quarter-over-quarter, new small business lending increased 7.3 percent due to a 16.3 percent increase in term loans, primarily driven by lending at large banks.
Chart 3: Credit Line Usage Remains Stable
Skip to data visualization tableSource: FR 2028D, items 5.b and 5.c.
| Quarters | Total | Fixed Rate | Variable Rate |
|---|---|---|---|
| 2017:Q4 | 38.28 | 36.33 | 38.44 |
| 2018:Q1 | 38.79 | 29.62 | 39.87 |
| 2018:Q2 | 38.84 | 35.07 | 39.2 |
| 2018:Q3 | 37.91 | 39.85 | 37.71 |
| 2018:Q4 | 40.76 | 43.25 | 40.49 |
| 2019:Q1 | 41.05 | 43.66 | 40.77 |
| 2019:Q2 | 39.71 | 41.38 | 39.53 |
| 2019:Q3 | 39.43 | 37.56 | 39.66 |
| 2019:Q4 | 39.73 | 37.15 | 40.04 |
| 2020:Q1 | 39.98 | 36.42 | 40.34 |
| 2020:Q2 | 35.26 | 37.69 | 34.99 |
| 2020:Q3 | 33.46 | 40.64 | 32.66 |
| 2020:Q4 | 32.2 | 40.72 | 31.33 |
| 2021:Q1 | 30.83 | 38.2 | 30.16 |
| 2021:Q2 | 30.77 | 39.17 | 29.97 |
| 2021:Q3 | 32 | 44.04 | 30.94 |
| 2021:Q4 | 31.56 | 41.86 | 30.71 |
| 2022:Q1 | 31.79 | 41.35 | 31 |
| 2022:Q2 | 32.08 | 36.64 | 31.63 |
Total credit line usage remained stable in the second quarter at 32 percent. Use of fixed rate lines of credit decreased from 41 percent in the first quarter to approximately 37 percent in the second quarter; however, fixed rate lines accounted for only 10 percent of total credit line usage.
Chart 4: Rates Increase on New Term Loans
Skip to data visualization tableNote: Items are calculated using a subset of 96 respondents that completed the FR 2028D for the last five quarters surveyed.
Source: FR 2028D, item 7.c.
| Quarters | Fixed | Variable |
|---|---|---|
| 2021:Q2 | 2.51 | 4 |
| 2021:Q3 | 4.14 | 4.25 |
| 2021:Q4 | 4.08 | 4.14 |
| 2022:Q1 | 4.24 | 4.45 |
| 2022:Q2 | 4.76 | 5.35 |
Median interest rates increased for new variable and fixed rate small business loans in the second quarter of 2022. The variable rate median was reported as 5.35 percent and the fixed rate median was reported as 4.76 percent. Median interest rates for variable term loans increased 90bp since the first quarter of 2022, while fixed rate loans increased 52bp during the same period. Since the second quarter of 2021, the median interest rates on fixed rate term loans have increased substantially by about 225bp, consistent with the paydowns and forgiveness of PPP loans that originated at a 1 percent rate along with the overall rising rate environment.
Chart 5: Rates Increase on New Lines of Credit
Skip to data visualization tableNote: Items are calculated using a subset of 96 respondents that completed the FR 2028D for the last five quarters surveyed.
Source: FR 2028D, item 8.d.
| Quarters | Fixed | Variable |
|---|---|---|
| 2021:Q2 | 4.02 | 4.19 |
| 2021:Q3 | 3.81 | 4.11 |
| 2021:Q4 | 3.85 | 4.24 |
| 2022:Q1 | 4 | 4.4 |
| 2022:Q2 | 4.36 | 5.58 |
Median interest rates on new small business lines of credit increased for both variable and fixed interest rates in the second quarter of 2022. The median interest rate for variable and fixed rate lines of credit was reported as 5.58 percent and 4.36 percent, respectively. This was an 118bp increase for variable lines and 36bp increase for fixed rate lines since the first quarter of 2022. The variable rate increase is directionally consistent with the 125bp increase in the Federal Funds Rate during the second quarter.
Chart 6: New Loans with Interest Rate (IR) Floors Remain Stable
Skip to data visualization tableSources: FR 2028D, items 7.a, 7.f, 8.a, 8.e and Federal Reserve Bank of St. Louis, 3-Month Treasury Constant Maturity Rate.
| Quarter | Percent of Loan Balances with IR Floor | Three-Month Treasury Rate |
|---|---|---|
| 2017:Q4 | 8.07 | 1.21 |
| 2018:Q1 | 6.22 | 1.56 |
| 2018:Q2 | 8.86 | 1.84 |
| 2018:Q3 | 9.43 | 2.04 |
| 2018:Q4 | 8.64 | 2.32 |
| 2019:Q1 | 7.98 | 2.39 |
| 2019:Q2 | 8.15 | 2.3 |
| 2019:Q3 | 8.58 | 1.98 |
| 2019:Q4 | 8.80 | 1.58 |
| 2020:Q1 | 8.00 | 1.11 |
| 2020:Q2 | 9.82 | 0.14 |
| 2020:Q3 | 8.60 | 0.11 |
| 2020:Q4 | 8.39 | 0.09 |
| 2021:Q1 | 5.47 | 0.05 |
| 2021:Q2 | 5.85 | 0.03 |
| 2021:Q3 | 5.67 | 0.04 |
| 2021:Q4 | 5.85 | 0.06 |
| 2022:Q1 | 5.01 | 0.55 |
| 2022:Q2 | 4.87 | 1.72 |
Despite a 117bp increase in the three-month Treasury Rate in the second quarter of 2022, the percentage of new variable-rate loans with interest rate floors remained relatively unchanged.
Chart 7: Respondents Report Increase in Credit Line Usage
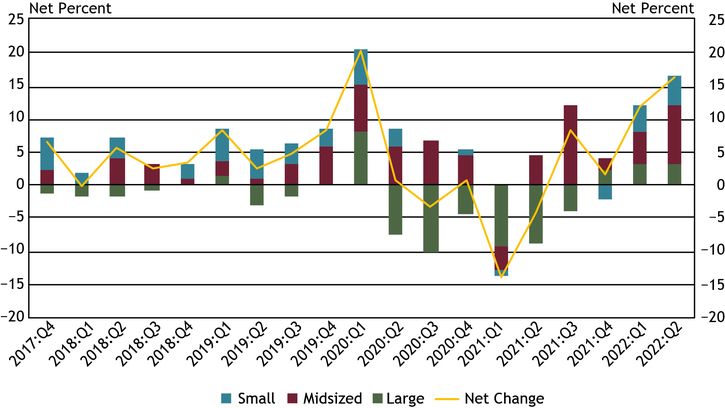
Note: Chart 7 shows diffusion indexes for credit line usage. The diffusion indexes show the difference between the percent of banks reporting decreased credit line usage and those reporting increased credit line usage. Net percent refers to the percent of banks that reported having decreased (“decreased somewhat” or “decreased substantially”) minus the percent of banks that reported having increased (“increased somewhat” or “increased substantially”).*
Source: FR 2028D, items 11 and 12.
In the second quarter, about 27 percent of respondents reported a change in credit line usage, with about 17 percent of respondents on net indicating that credit line usage increased. On net, increases in credit line usage were reported for all bank sizes. Of the banks reporting an increase, 52 percent cited changes in national or local economic conditions as a very important reason, while 43 percent cited changes in borrowers’ business revenue or other business-specific conditions. The reported increase in credit line usage is consistent with a shift to increased debt financing observed in other key indicators such as spiking consumer credit card debt.**
*Small banks have total assets of $1 billion or less, midsized banks have total assets between $1 billion and $10 billion and large banks have total assets greater than $10 billion.
**Source: FRED, Consumer Loans: Credit Cards and Other Revolving Plans.
Chart 8: Respondents Report Weaker Loan Demand
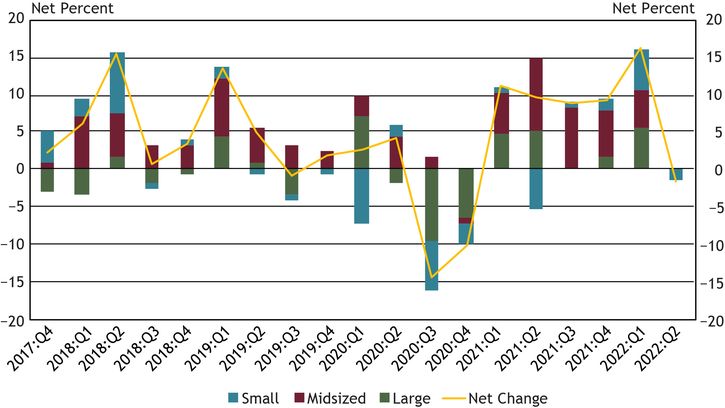
Note: Chart 8 shows diffusion indexes for loan demand. The diffusion indexes show the difference between the percent of banks reporting weakened loan demand and those reporting stronger loan demand. Net percent refers to the percent of banks that reported having weakened (“moderately weaker” or “substantially weaker”) minus the percent of banks that reported having stronger loan demand (“moderately stronger” or “substantially stronger”).
Source: FR 2028D, item 13.
In the second quarter of 2022, about 36 percent of banks reported a change in small business loan demand, a slight decrease from the first quarter. On net, large and midsized banks were evenly split between stronger or weaker loan demand with about 2 percent of small banks indicating weaker loan demand. The change in the net loan demand from an increase of about 16 percent in first quarter of 2022 to a decrease of about 2 percent in second quarter is the largest quarter-over-quarter decrease in loan demand since the third quarter of 2020.
Chart 9: Impact of Supply Chain Disruptions on Loan Demand Remains Steady
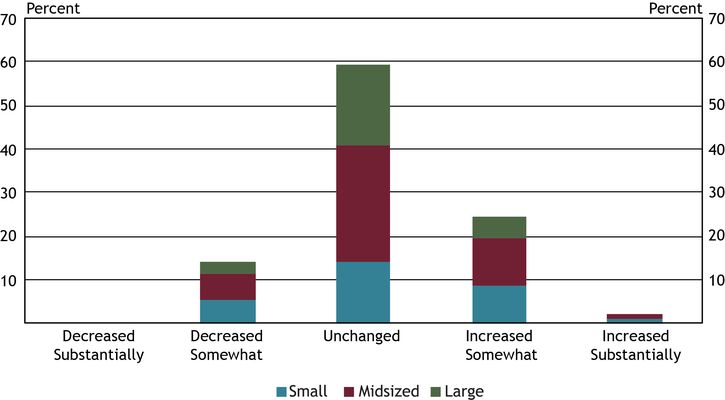
Source: FR 2028D, Special Question.
Supply chain disruptions continue to weigh on small businesses with 41 percent of banks attributing a change in small business loan demand to the disruptions, a 1 percent increase compared to the first quarter of 2022. About 26 percent of banks reported the disruptions increased loan demand for small businesses while 14 percent indicated loan demand decreased somewhat. The most cited reasons for an increase in demand were related to the need for small businesses to carry more inventory due to future supply chain concerns and the need for additional capital due to increasing prices. The most cited reason for a decrease in demand was related to small businesses being less likely to start new projects due to increased costs from constrained inventories.
Chart 10: Loan Approval Rates Remain Stable for All Bank Sizes
Skip to data visualization tableSource: FR 2028D, items 14.a and 15.
| Quarter | Small | Midsized | Large |
|---|---|---|---|
| 2017:Q4 | 88.14 | 75.33 | 51.07 |
| 2018:Q1 | 87 | 86.15 | 56.78 |
| 2018:Q2 | 86.32 | 80.9 | 48.71 |
| 2018:Q3 | 85.07 | 85.5 | 52.83 |
| 2018:Q4 | 82.91 | 85.18 | 55.04 |
| 2019:Q1 | 89.81 | 86.15 | 55.12 |
| 2019:Q2 | 89.68 | 81.5 | 55.45 |
| 2019:Q3 | 79 | 80.93 | 54.01 |
| 2019:Q4 | 86.87 | 76.18 | 53.58 |
| 2020:Q1 | 87.44 | 75.45 | 51.93 |
| 2020:Q2 | 87.98 | 95.12 | 74.54 |
| 2020:Q3 | 86.52 | 89.81 | 38.33 |
| 2020:Q4 | 89.52 | 79.64 | 45.56 |
| 2021:Q1 | 89.73 | 88.23 | 51.24 |
| 2021:Q2 | 93.5 | 89.83 | 46.85 |
| 2021:Q3 | 71.2 | 85.2 | 49.78 |
| 2021:Q4 | 81 | 87.23 | 50.5 |
| 2022:Q1 | 83.15 | 77.35 | 51.31 |
| 2022:Q2 | 83.25 | 80.43 | 51.83 |
Application approval rates remain relatively stable for all respondent banks from the first quarter to second quarter 2022. The two most cited reasons for denying a loan were borrower financials and credit history. Large institution approval rates have remained stable over the last six consecutive quarters, approximating pre-pandemic levels from second quarter 2018 through first quarter 2020.
Chart 11: Credit Quality Diminishes for Large and Midsized Banks
Note: Chart 11 shows diffusion indexes for credit quality of applicants. The diffusion indexes show the difference between the percent of banks reporting a decline in credit quality and those reporting improvement in credit quality. Net percent refers to the percent of banks that reported declining credit quality (“declined somewhat” or “declined substantially”) minus the percent of banks that reported improving credit quality (“improved somewhat” or “improved substantially”).
Source: FR 2028D, items 20 and 21.
About 4 percent of respondents, on net, reported a decrease in applicant credit quality, reversing four quarters of increases. Midsized and large banks reported a net decrease of about 2 percent during the second quarter. Of respondents reporting a change in credit quality, whether an increase or decrease, 57 percent cited the debt-to-income level of commercial borrowers as a very important reason for the change. Other commonly cited reasons for a change were the liquidity positions of borrowers, willingness to pledge personal assets, and prospects for business growth or enterprise values.
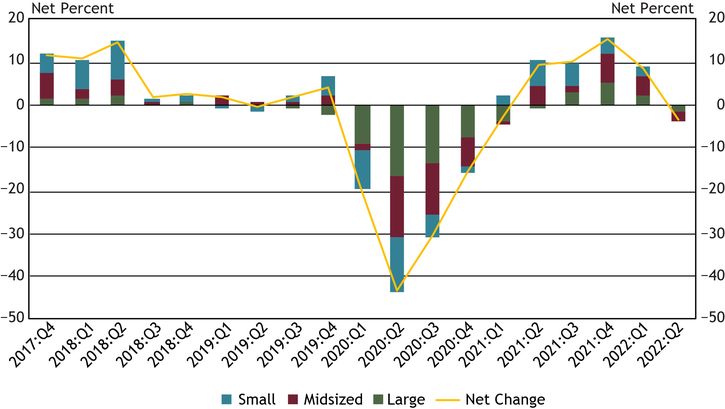
Chart 12: Banks Tighten Credit Standards and Loan Terms
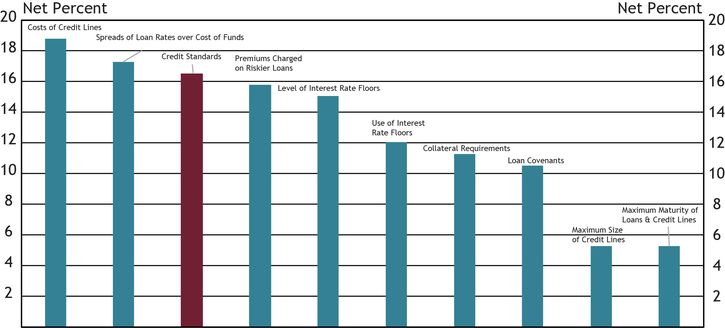
Note: Chart 12 shows diffusion indexes for credit standards (red bar) and various loan terms. The diffusion indexes show the difference between the percent of banks reporting tightening terms and those reporting easing terms. Net percent refers to the percent of banks that reported having tightened (“tightened somewhat” or “tightened considerably”) minus the percent of banks that reported having eased (“eased somewhat” or “eased considerably”).
Source: FR 2028D, items 16, 17, 18 and 19.
About 16.5 percent of respondents reported a change in credit standards (red bar) in the second quarter of 2022, up about 1 percent from the first quarter. For the first time since the survey was implemented in 2017, all banks that indicated a change in credit standards reported they were tightening.
On net, respondents indicated that all loan terms tightened with the cost of credit lines and spreads of loan rates over cost of funds tightening the most. Respondents reporting tightening credit standards or loan terms in the second quarter cited a less favorable or more uncertain economic outlook and worsening industry-specific problems as the primary drivers.
Other contributors to the release include Nicholas Bloom, Dan Harbour, Thomas Hobson, Stefan Jacewitz, Alli Jakubek, Emily Robinson, and Tony Walker.
Endnotes
-
1 Small business lending refers to small business Commercial & Industrial lending unless explicitly noted otherwise.
The views expressed are those of the authors and do not necessarily reflect the positions of the Federal Reserve Bank of Kansas City or the Federal Reserve System.
Authors

Dustyn DeSpain, Assistant Vice President
Assistant Vice President