Small business commercial and industrial (C&I) loan* balances decreased compared to first quarter 2021, the last full quarter of the Paycheck Protection Program (PPP). New small business loan balances demonstrated the most dramatic decline of approximately 76 percent, while outstanding small business loan balances decreased by 36 percent. When compared to the previous quarter, small business lending also declined but at a less significant rate. The survey’s 122 respondents, on net, reported increased loan demand and increased credit quality in the first quarter but indicated tightening credit standards and loan terms. Most respondents, to the survey’s special question on supply chain disruptions, indicated that the disruptions had no impact on their small business lending.
Chart 1: Outstanding Small Business Loan Balances Decrease
Skip to data visualization tableNote: Items are calculated using a subset of 90 respondents that completed the FR 2028D for the last five quarters surveyed.
Sources: Call Report, Schedule RC-C Part I, items 4. Commercial and Industrial Loans and 12. Total Loans and Leases Held for Investment and Held for Sale; Small Business Administration, and FR 2028D, items 4.b and 5.c.
| Quarter-Over-Quarter | Total Loans | C&I Loans | Small Business C&I Loans |
|---|---|---|---|
| 2021:Q2 | -0.1 | -2.86 | -13.1 |
| 2021:Q3 | 0.01 | -1.67 | -16.53 |
| 2021:Q4 | 5.46 | 8.16 | -4.28 |
| 2022:Q1 | 1.42 | 4.46 | -7.64 |
| Year-Over-Year 2022: Q1 | 6.85 | 7.91 | -35.87 |
Small business loan balances in the first quarter decreased 7.6 percent quarter-over-quarter and 35.9 percent year-over-year. The continued year-over-year decline in small business loan balances is largely attributable to the expiration of the PPP and continuing forgiveness of PPP loan balances. According to the SBA, 90 percent of total PPP loan balances had been forgiven as of March 27, 2022, a 7 percent increase compared with the fourth quarter of 2021. Total loans and total C&I loans increased 6.9 percent and 7.9 percent, respectively, compared with the first quarter of 2021.
Chart 2: New Small Business Loans Decline Substantially Year-Over-Year
Skip to data visualization tableNote: Items are calculated using a subset of 90 respondents that completed the FR 2028D for the last five quarters surveyed. All loan types referenced in Chart 2 refer to small business lending.
Sources: FR 2028D, items 7.b and 8.c.
| Quarter-Over-Quarter | New C&I Loans | New C&I Term Loans | New C&I Credit Lines |
|---|---|---|---|
| 2021:Q2 | -60.65 | -65.08 | -18.54 |
| 2021:Q3 | -37.9 | -51.06 | 15.66 |
| 2021:Q4 | 5.96 | -1.39 | 18.61 |
| 2022:Q1 | -9.02 | -9.87 | -7.79 |
| Year-Over-Year 2022:Q1 | -76.44 | -84.81 | 3.05 |
New small business loan balances decreased 76.4 percent in the first quarter compared with the previous year, driven by an 84.8 percent decrease in new term loans. The majority of the decrease in new term loans is attributable to the expiration of the PPP program and ongoing PPP loan forgiveness and paydowns. Quarter-over-quarter, new small business lending declined 9.0 percent due to a combined decrease in new term loans and credit lines. The decrease in new small business lending could be attributed to declining demand resulting from rising interest rates near the end of the first quarter.
Chart 3: Credit Line Usage Remains Stable
Skip to data visualization tableSources: FR 2028D, items 5.b and 5.c.
| Quarter | Total | Fixed Rate | Variable Rate |
|---|---|---|---|
| 2017:Q4 | 38.28 | 36.33 | 38.44 |
| 2018:Q1 | 38.79 | 29.62 | 39.87 |
| 2018:Q2 | 38.84 | 35.07 | 39.2 |
| 2018:Q3 | 37.91 | 39.85 | 37.71 |
| 2018:Q4 | 40.76 | 43.25 | 40.49 |
| 2019:Q1 | 41.05 | 43.66 | 40.77 |
| 2019:Q2 | 39.71 | 41.38 | 39.53 |
| 2019:Q3 | 39.43 | 37.56 | 39.66 |
| 2019: Q4 | 39.73 | 37.15 | 40.04 |
| 2020:Q1 | 39.98 | 36.42 | 40.34 |
| 2020:Q2 | 35.26 | 37.69 | 34.99 |
| 2020:Q3 | 33.46 | 40.64 | 32.66 |
| 2020:Q4 | 32.2 | 40.72 | 31.33 |
| 2021:Q1 | 30.83 | 38.2 | 30.16 |
| 2021:Q2 | 30.77 | 39.17 | 29.97 |
| 2021:Q3 | 32 | 44.04 | 30.94 |
| 2021:Q4 | 31.56 | 41.86 | 30.71 |
| 2022:Q1 | 31.79 | 41.35 | 31 |
The overall use of small business credit lines remained stable at 32 percent in the first quarter of 2022, despite a slight decline in the utilization of fixed rate credit lines. The use of variable rate small business credit lines paralleled total credit line usage at 31 percent quarter-over-quarter. As of first quarter 2022, respondents indicated that variable rate lines make up about 90 percent of total credit line usage.
Chart 4: Rates Increase Slightly on New Term Loans
Skip to data visualization tableNote: Items are calculated using a subset of 90 respondents that completed the FR 2028D for the last five quarters surveyed
Source: FR 2028D, item 7.c.
| Quarter | Fixed | Variable |
|---|---|---|
| 2021:Q1 | 1.3 | 4.19 |
| 2021:Q2 | 2.51 | 4.24 |
| 2021:Q3 | 4.16 | 4.25 |
| 2021:Q4 | 4.13 | 4.3 |
| 2022:Q1 | 4.28 | 4.47 |
Median interest rates increased slightly for both variable and fixed rate small business loans in the first quarter of 2022. The variable rate median was reported as 4.47 percent and the fixed rate median was reported as 4.28 percent, both increasing approximately 17 basis points from the previous quarter. Since the first quarter of 2021, the median fixed rates on term loans have increased about 3 percent, consistent with the forgiveness of PPP loans that originated at an interest rate of 1 percent.
Chart 5: Rates Increase on New Lines of Credit
Skip to data visualization tableNote: Items are calculated using a subset of 90 respondents that completed the FR 2028D for the last five quarters surveyed
Source: FR 2028D, item 8.d.
| Quarter | Fixed | Variable |
|---|---|---|
| 2021:Q1 | 4.19 | 4.08 |
| 2021:Q2 | 4.25 | 4.19 |
| 2021:Q3 | 3.99 | 4.14 |
| 2021:Q4 | 3.88 | 4.21 |
| 2022:Q1 | 4.16 | 4.49 |
Median rates on new small business lines of credit increased for both variable and fixed rate lines in the first quarter of 2022. The median interest rate for variable rate lines of credit was reported as 4.49 percent and the fixed rate median was reported as 4.16 percent, increasing about 28 basis points from the previous quarter. The variable rate increase is directionally consistent with the Federal Open Market Committee’s (FOMC) 50 basis point increase announced on March 16, 2022.
Chart 6: New Loans with Interest Rate (IR) Floors Decrease
Skip to data visualization tableSources: FR 2028D, items 7.a, 7.f, 8.a, 8.e and Federal Reserve Bank of St. Louis, 3-Month Treasury Constant Maturity Rate.
| Quarter | Percent of New Loans with IR Floor | 3-Month Treasury Rate |
|---|---|---|
| 2017:Q4 | 8.07 | 1.21 |
| 2018:Q1 | 6.22 | 1.56 |
| 2018:Q2 | 8.86 | 1.84 |
| 2018:Q3 | 9.43 | 2.04 |
| 2018:Q4 | 8.64 | 2.32 |
| 2019:Q1 | 7.98 | 2.39 |
| 2019:Q2 | 8.15 | 2.3 |
| 2019:Q3 | 8.58 | 1.98 |
| 2019:Q4 | 8.80 | 1.58 |
| 2020:Q1 | 8.00 | 1.11 |
| 2020:Q2 | 9.82 | 0.14 |
| 2020:Q3 | 8.60 | 0.11 |
| 2020:Q4 | 8.39 | 0.09 |
| 2021:Q1 | 5.47 | 0.05 |
| 2021:Q2 | 5.85 | 0.03 |
| 2021:Q3 | 5.67 | 0.04 |
| 2021:Q4 | 5.85 | 0.06 |
| 2022:Q1 | 5.01 | 0.55 |
The percentage of variable rate loans with interest rate floors has remained relatively stable throughout 2021 but decreased from 5.9 to 5 percent in the first quarter of 2022. In a rising rate environment, as demonstrated by the 49 basis point increase in the three-month Treasury Rate, lenders may be less likely to utilize interest rate floors to hedge against falling rates on new loans.
Chart 7: Respondents Report Increase in Credit Line Usage
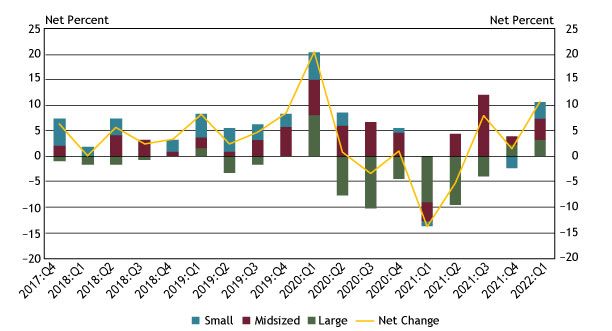
Notes: Chart 7 shows diffusion indexes for credit line usage. The diffusion indexes show the difference between the percent of banks reporting decreased credit line usage and those reporting increased credit line usage. Net percent refers to the percent of banks that reported having decreased (“decreased somewhat” or “decreased substantially”) minus the percent of banks that reported having increased (“increased somewhat” or “increased substantially”).**
Sources: FR 2028D, items 11 and 12.
In the first quarter, about 28 percent of respondents reported a change in credit line usage, with about 11 percent of respondents on net indicating that credit line usage increased. On net, increases in credit line usage were reported for all bank sizes. Of the banks reporting a change, 48 percent cited changes in national or local economic conditions as a very important reason for a change while 34 percent cited changes in borrower’s business revenue or other business-specific conditions.
Chart 8: Respondents Report Stronger Loan Demand
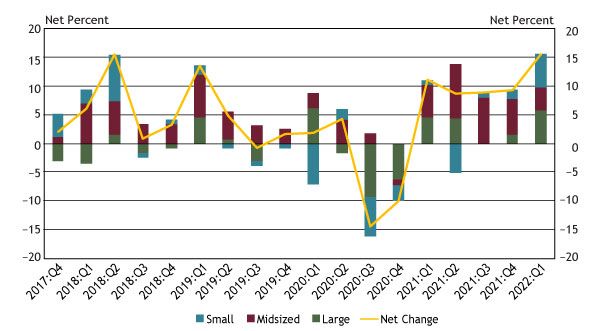
Notes: Chart 8 shows diffusion indexes for loan demand. The diffusion indexes show the difference between the percent of banks reporting weakened loan demand and those reporting stronger loan demand. Net percent refers to the percent of banks that reported having weakened (“moderately weaker” or “substantially weaker”) minus the percent of banks that reported having stronger loan demand (“moderately stronger” or “substantially stronger”).
Source: FR 2028D, item 13.
In the first quarter of 2022, about 37 percent of banks reported a change in small business loan demand. On net, the number of large and small banks indicating stronger loan demand was about 6 percent, compared with about 4 percent of midsized banks. The net percent of respondents indicating stronger loan demand has increased from about 9 percent throughout 2021 to 16 percent in the first quarter of 2022, which is the highest level since the inception of the survey.
Chart 9: Some Banks Indicate Increased Loan Demand due to Supply Chain Disruptions
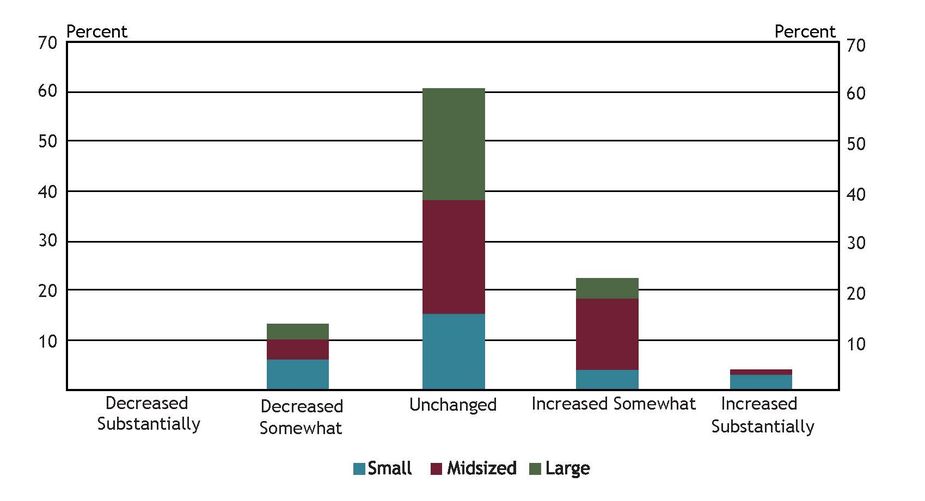
Source: FR 2028D, Special Question.
While most banks indicated no change in small business lending from supply chain disruptions, about 26 percent of banks reported that the disruptions increased loan demand for small businesses during the last 12 months. The most cited reason for an increase in demand was related to small businesses carrying more inventory due to future supply chain concerns. About 60 percent of respondents indicated loan demand associated with supply chain disruptions remained unchanged while 13 percent indicated loan demand decreased somewhat. The most cited reason for a decrease in demand was related to small businesses having less need for working capital due to constrained inventory availability.
Chart 10: Loan Approval Rates Decrease for Midsized Banks
Skip to data visualization tableSources: FR 2028D, items 14.a and 15.
| Bank Size | Small | Midsized | Large |
|---|---|---|---|
| 2017:Q4 | 88.14 | 75.33 | 51.07 |
| 2018:Q1 | 87 | 86.15 | 56.78 |
| 2018:Q2 | 86.32 | 80.9 | 48.71 |
| 2018:Q3 | 85.07 | 85.5 | 52.83 |
| 2018:Q4 | 82.91 | 85.18 | 55.04 |
| 2019:Q1 | 89.81 | 86.15 | 55.12 |
| 2019:Q2 | 89.68 | 81.5 | 55.45 |
| 2019:Q3 | 79 | 80.93 | 54.01 |
| 2019:Q4 | 86.87 | 76.18 | 53.58 |
| 2020:Q1 | 87.44 | 75.45 | 51.93 |
| 2020:Q2 | 87.98 | 95.12 | 74.54 |
| 2020:Q3 | 86.52 | 89.81 | 38.33 |
| 2020:Q4 | 89.52 | 79.64 | 45.56 |
| 2021:Q1 | 89.73 | 88.23 | 51.24 |
| 2021:Q2 | 93.5 | 89.83 | 46.85 |
| 2021:Q3 | 71.2 | 85.2 | 49.78 |
| 2021:Q4 | 81 | 87.23 | 50.5 |
| 2022:Q1 | 83.15 | 77.35 | 51.31 |
Application approval rates declined for midsized banks from 87 percent in the fourth quarter of 2021 to 77 percent in the first quarter of 2022. In contrast, approval rates for small banks steadily increased from 81 percent to 83 percent, while approval rates for large banks remain unchanged at 51 percent. The two most cited reasons for denying a loan were borrower financials and credit history.
Chart 11: Credit Quality Increases Across All Bank Sizes
Notes: Chart 11 shows diffusion indexes for credit quality of applicants. The diffusion indexes show the difference between the percent of banks reporting a decline in credit quality and those reporting improvement in credit quality. Net percent refers to the percent of banks that reported declining credit quality (“declined somewhat” or “declined substantially”) minus the percent of banks that reported improving credit quality (“improved somewhat” or “improved substantially”).
Sources: FR 2028D, items 20 and 21.
About 9 percent of banks, on net, reported an increase in applicant credit quality. All three bank sizes reported a net increase, with midsized banks reporting the largest increase of 4 percent. Of respondents reporting a change in credit quality, whether an increase or decrease, 48 percent cited the debt-to-income level of commercial borrowers as a very important reason for the change. Other commonly cited reasons for a change were the liquidity positions of borrowers and recent business income growth.
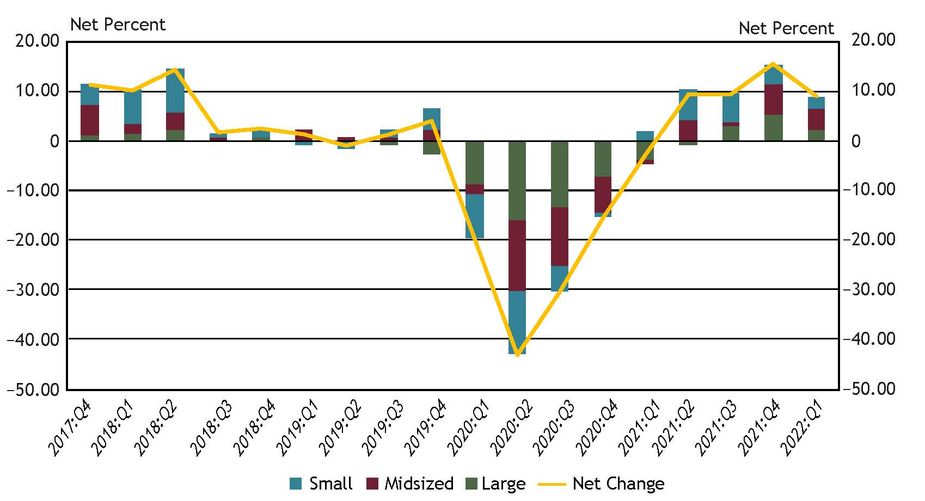
Chart 12: Banks Tighten Credit Standards and Loan Terms
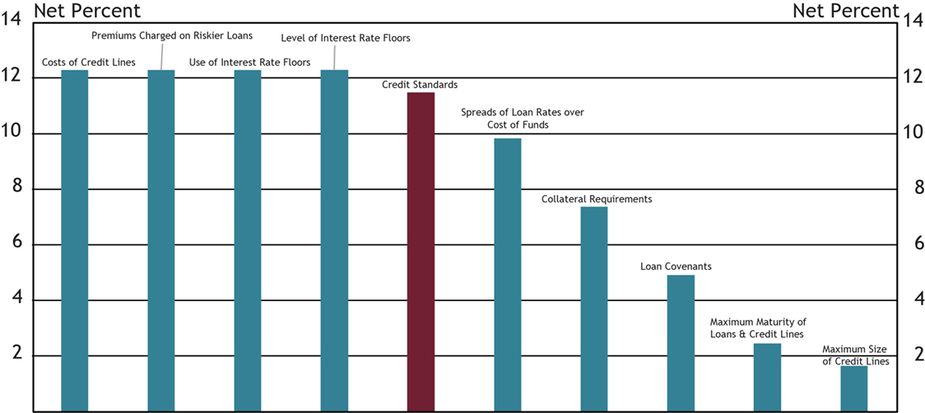
Note: Chart 12 shows diffusion indexes for credit standards (red bar) and various loan terms. The diffusion indexes show the difference between the percent of banks reporting tightening terms and those reporting easing terms. Net percent refers to the percent of banks that reported having tightened (“tightened somewhat” or “tightened considerably”) minus the percent of banks that reported having eased (“eased somewhat” or “eased considerably”).
Source: FR 2028D, items 16, 17, 18 and 19.
About 16 percent of respondents reported a change in credit standards in the first quarter of 2022, up about 4 percent from the fourth quarter of 2021. Of banks indicating a change in credit standards, 11.5 percent, on net, reported tightening credit standards, an increase of about 8.4 percent from the previous quarter.
On net, respondents indicated that all loan terms tightened with the cost of credit lines, premiums charged on riskier loans, use of interest rate floors, and level of interest rate floors tightening the most. Respondents reporting tightening credit standards or loan terms in the first quarter cited a less favorable or more uncertain economic outlook and worsening industry-specific problems as the primary drivers.
Other contributors to the release include Nicholas Bloom, Dan Harbour, Thomas Hobson, Stefan Jacewitz, Emily Robinson, Trudy Vandever and Tony Walker.
Endnotes
-
1 *Small business lending refers to small business Commercial & Industrial lending unless explicitly noted otherwise.
-
2 **Small banks have total assets of $1 billion or less, midsized banks have total assets between $1 billion and $10 billion and large banks have total assets greater than $10 billion.
The views expressed are those of the authors and do not necessarily reflect the positions of the Federal Reserve Bank of Kansas City or the Federal Reserve System.
Authors

Dustyn DeSpain, Assistant Vice President
Assistant Vice President