General Assessment
Indicators of economic and financial conditions in low- and moderate-income (LMI) communities computed from results of the Kansas City Fed’s LMI Survey for the first half of 2015 suggest that the LMI economy continues to improve, but recovery remains modest and somewhat unpredictable. Indicators often fluctuate between improvement and deterioration from survey period to survey period.1
LMI individuals (or families or households) are those with incomes less than 80 percent of area median income. For those in urban areas, area median income is the value for the metropolitan area; for those in rural areas, it is state median income.
With the exception of the LMI Service Needs Index, detailed below, indexes constructed from survey data reached their maximum values in mid-2013, indicating the assessments of economic conditions made by survey respondents at that time were more favorable than in previous surveys. Most indicators have since recovered from a decline and are near those peak values. These indicators reveal perceptions not only of economic conditions broadly, but also perceptions of economic performance in more specific areas, such as job availability, affordable housing and access to credit.
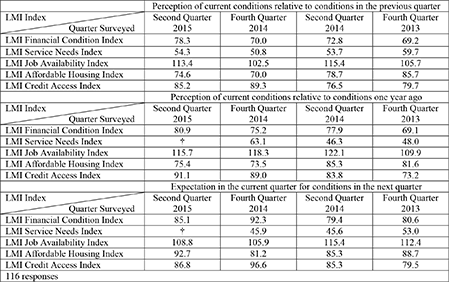
The LMI Financial Condition Index, the broadest assessment of economic conditions in the LMI community, rose from 70.0 to 78.3 in the first half of 2015, moving closer to its high of 85.7 in mid-2013 (Chart 1).2 A value of 78.3—still significantly below a neutral reading of 100—indicates moderate deterioration in general economic conditions in the LMI community.3 Improvement in the LMI labor market was likely the main factor affecting this general appraisal of LMI economic conditions, as movement in other indicators was generally more modest, and labor market outcomes are critical to the economic condition of individuals and their families.
Chart 1: LMI Financial Condition and LMI Services Needs Indexes
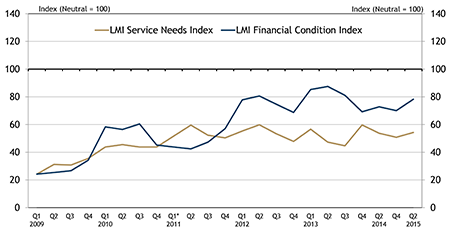
Another broad indicator of LMI economic conditions is the LMI Service Needs Index, which rose from 50.8 to 54.3 (Chart 1). The index reflects the demand for services provided by organizations responding to the survey; an increase in demand for these services, typically an indicator of deterioration in economic conditions, is associated with a decline in the index.4 As the most objective question in the survey, the pattern in this index complements the more subjective poll of assessments of financial well-being reflected in the LMI Financial Condition Index.
Demand for services usually is closely tied to income. Survey respondents suggested, as in the past, that low incomes typically have driven LMI households to the services of family and community support organizations, especially if public assistance is lacking or waning. For example, one survey participant noted that “$8.75 per hour” disqualifies a worker from SNAP (USDA Supplemental Nutrition Assistance Program, formerly food stamps) but does not qualify him to “rent an apartment.” Nevertheless, the demand for services depends on a number of other, non-income factors, especially the lack of access to affordable consumer goods and services. For example, respondents commonly lamented about the seemingly immutable problem of “food deserts.”5 A significant share of general comments from the survey reflected needs for housing assistance.
Labor Market
Labor market conditions typically are the primary driver of overall evaluations of economic conditions. Indicators of labor market conditions were strongest among all indicators in the LMI Survey, and the analysis of external data supports the survey’s assessment that labor market conditions have improved significantly since reaching their low point in 2010-11.
LMI Survey Results
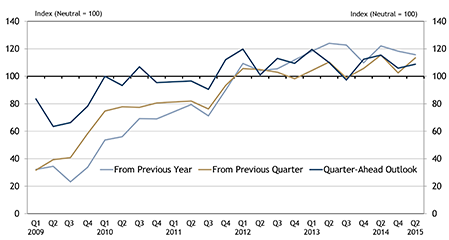
Results from the LMI Survey’s inquiry on the availability of jobs for LMI workers improved significantly in the second quarter, rising from 102.5 to 113.4 (Chart 2).6 The mid-2015 value puts the index well above neutral, implying that the general consensus of survey participants was that jobs for LMI workers were increasingly available (although the number of participants reporting an increase in job availability exceeded the number reporting a decline, the majority of respondents reported that there had been little to no change in job availability since the previous quarter). The mid-2015 outcome roughly matches the index’s post-recession high in mid-2014. The year-over-year assessment and quarter-ahead outlook changed little from the most recent survey for year-end 2014 and continued to show that job availability was higher than a year ago. It also indicated that additional improvement was expected over the next quarter.
Chart 2: LMI Job Availability Index
A special question in the July 2015 survey noted that “many reports indicate that labor market performance has improved” and asked survey participants to “evaluate the degree to which low- and moderate-income workers have shared in this gain and the pay associated with new jobs relative to pre-recession pay.” Most respondents who reported increased job availability and/or wage gains associated these improvements with an expanding economy. Many of those who reported little improvement, or in rare cases contraction, lamented a lack of economic growth sufficient to support job or wage gains in the LMI community.
Responses to the special question varied widely across the District. One commenter argued that if LMI individuals are “looking for work and don’t feel they are above it, there is work available,” referring specifically to jobs in the retail sector. Some also reported that sufficient work is available for those who do not have circumstances which make them especially difficult to employ, such as ex-offenders and those with a history of drug abuse.
Regarding wages associated with new jobs available to LMI workers, the consensus was that wages had changed very little, although some responses indicated there had been moderate increases and highlighted wage gains to workers in areas where minimum wages had increased. Among those who reported some increase in wages, many said wage growth was below the increase in the general cost of living. Some survey participants suggested part-time jobs represent a significant share of all new jobs.
Although the labor market has performed relatively well in terms of gross job availability, survey respondents reported a number of labor market issues that still challenge LMI workers. Most common were a lack of education, training and experience sufficient to advance workers in the current labor market. Others reported challenges in health, transportation and child care.
Analysis of External Data
The U.S. Bureau of Labor Statistics (BLS) typically releases a number of alternative unemployment statistics in addition to the commonly reported, “headline” unemployment rate, currently at 5.3 percent for the nation. Most of the alternative measures of labor utilizations are released only for the entire United States and individual states (annual averages are released on a quarterly basis for states).7 Thus, one cannot readily locate similar data for defined income classes; educational attainment cohorts; occupational classes; or consolidated districts, such as the Tenth District. For this report, individual household data from the Current Population Survey (CPS) were used to calculate these statistics for Tenth District states.8
Unemployment
The official U.S. unemployment rate published by the BLS (known as U-3) was 5.3 percent in July, on a seasonally adjusted basis, down from 5.6 percent in December 2014 and 6.2 percent in July 2014. This rate is the share of the labor force that is not currently working but actively seeking employment.
LMI Breakdown of Unemployment
Unemployment rates by income group are not reported in government statistics, and disentangling unemployment and income is difficult. For example, an unemployed worker is likely to have little or no income, and those in low-income families are more likely to be unemployed.9 Some insights are provided by more narrow statistics that can be related to characteristics typical of LMI workers, such as educational attainment. Specifically, unemployment is highly correlated with educational attainment, and LMI workers typically are less educated than higher-income workers.10 In 2014, the unemployment rate of those with a bachelor’s degree was 3.2 percent, compared to 6 percent for those with a high school diploma, but no college.11 The unemployment rate for those who had not completed high school was 9 percent.
Duration of Unemployment
Particularly problematic among the unemployed are the long-term unemployed. The labor market circumstances facing long-term unemployed workers, defined by the BLS as workers unemployed for more than 26 weeks, typically are more dire than those for the short-term unemployed. The very long-term unemployed are more likely to have expended qualification for unemployment compensation benefits, either because of federal or state limits or improvements in labor market conditions that nullify extended benefit programs. They are also much more likely to have exhausted their personal financial resources, such as precautionary savings, retirement accounts and credit.
The long-term unemployed typically also have a much more difficult time securing a new job. Skills may atrophy or become obsolete over time. Employers recognize this potential, which may make them more reluctant to hire the long-term unemployed. In addition, employers may question why after an extended time a worker has been unable to secure another job when others have.
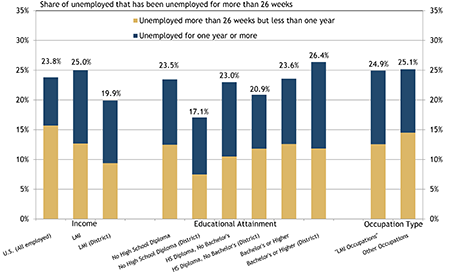
The rate of long-term unemployment accounted for one-quarter of all unemployed LMI workers in June, and just under 20 percent of unemployment for LMI workers in the District (Chart 3).12 About 24 percent of all unemployed workers in the U.S. were long-term unemployed. These figures, while high from a historical perspective, recently have improved considerably over a relatively short period of time. In the second half 2014 Tenth District LMI Labor Force Report, the long-term unemployment rate for Tenth District unemployed workers was about 31 percent and was 32 percent for all workers in the U.S.
Chart 3: Long-Term Unemployment
From a longer-run perspective, from post-World War II to pre-recession in 2007, the long-term unemployed share of total unemployment had never exceeded 25 percent (annual rate).13 Well over 40 percent of the unemployed, however, were long-term unemployed at the trough of the recent “employment recession” in 2010-11.
Compared to the United States, the District’s long-term unemployment rate is much lower, consistent with a much lower “headline” unemployment rate of 4.5 percent in the District in June (seasonally adjusted), compared to the U.S. rate of 5.3 percent. The rate of long-term unemployment is highly correlated with the overall unemployment rate: the higher the unemployment rate, the higher the long-term unemployment rate tends to be.14
Long-term unemployment rates by educational attainment and occupation group varied little.15
Marginally Attached Workers
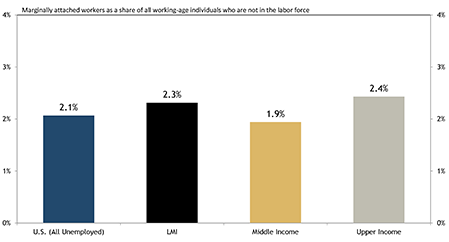
Beyond the official unemployment rate is a shadow group of individuals who are not officially unemployed, but are “marginally attached” to the labor force (Chart 4).16 A person is “marginally attached” to the labor force if s/he wants and is available for work and has looked for a job sometime in the prior 12 months (or since the end of their last job if they had one within the past 12 months), but is not counted as unemployed because s/he has not searched for work in the four weeks preceding the survey.17
Chart 4: Marginally Attached Workers
Discouraged workers, who accounted for 34.1 percent of all marginally attached workers in the most recent data, typify the marginally attached.18 Discouraged workers are not currently working and are not currently looking for work because they believe no jobs are available for them. This belief may derive from a variety of factors, including a perceived shortage of jobs, discrimination, insufficient qualification, a chronic illness or disability. The distinction between discouraged workers and other marginally attached workers is that discouraged workers are not actively seeking a job because they feel a search would be futile.19
The share of those not in the labor force that is marginally attached to the labor force does not vary consistently across income groups. The marginally attached rate was roughly equal for LMI and upper-income groups at 2.3 percent and 2.4 percent, respectively, but significantly lower for middle-income people at 1.9 percent.20 The difference is largely the degree of discouragement. The share of marginally attached workers that is discouraged was significantly higher for LMI individuals than for upper-income individuals. A comparison of discouraged workers with all marginally attached workers suggests that differences in LMI and middle-income marginal attachment to the labor force is driven by discouragement with the labor market, while upper-income people are much more likely to be marginally attached for reasons other than discouragement, such as “taking a break” from their job search. Individuals with lower levels of education are much more likely to be marginally attached (particularly discouraged) workers than those with more education, which is consistent with generally poorer labor market outcomes for those with less education.
Underemployment
Challenges to the LMI labor market extend beyond unemployment to “underemployment,” which typically is defined as an insufficient amount of work, but is often more broadly defined to include those who are working at an occupation that requires education, training and/or experience below those attained by the worker.
Among the employed, millions are part-time workers who would prefer a full-time job. Part-time employment is defined by the BLS as less than 35 hours per week. Most workers who are employed part time have sought part-time work intentionally. They may want to work only part time to devote more time to family or other pursuits, or they may simply be uninterested in working full time. Many are part time for economic reasons, however, such as slack work opportunities or business conditions.
For all employed workers in the United States in June 2015, 4.4 percent (in nonagricultural industries) were employed part time for economic reasons (Chart 5). For the Tenth District, a more moderate 3.7 percent of all workers were employed part time for economic reasons, consistent with better overall employment conditions in the District, as measured by the official unemployment rate. For District workers in LMI families, a significantly higher 6 percent was employed part time for economic reasons. While lower than the national rate, the share of workers in LMI families working part time for economic reasons was significantly higher when compared to the rate for all District workers.
Chart 5: Workers Employed Part Time for Economic Reasons
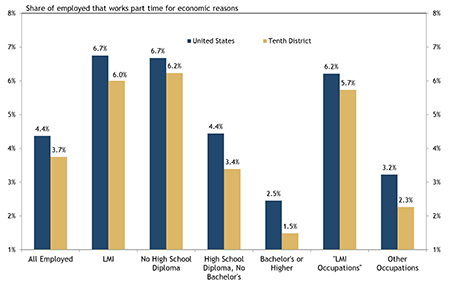
As with most other (un)employment statistics, the share of the employed working part time for economic reasons was lower for those in the Tenth District and those with more education. Specifically, 2.5 percent of employed people in the United States with a bachelor’s degree or higher were working part time for economic reasons, while 1.5 percent were working part time for economic reasons in the District. Comparatively, the share of employment for those who had completed high school but had not attended college and were working part time for economic reasons was 3.4 percent and was 6.2 percent for those who had not completed high school in the Tenth District. These statistics are consistent with overall better employment outcomes for those with more education.
Underemployment also arises when workers are employed in jobs below their skill level and experience, but data likely could not be collected on this phenomenon at reasonable cost and with reasonable precision. Nevertheless, a 2012 report from The Associated Press suggested that considering these factors, about half of all recent college graduates at that time were unemployed or underemployed.21
Affordable Housing
LMI Survey results
The LMI Affordable Housing Index rose from 70.0 to 74.6 in the July 2015 LMI Survey, partially reversing a more significant decline in the previous survey period. This index reflects that the availability of affordable housing continues to decline but at a somewhat slower pace than in the previous survey.22 As with other survey indexes, the affordable housing index reflects changes in conditions, and thus, does not address whether the current stock of housing is sufficient to meet current needs.
In their comments, most survey respondents reported that the current stock of affordable housing is inadequate. The capacity of existing affordable housing to meet community needs varies across the Tenth District. Several survey respondents reported that affordable housing is becoming more available in their communities, and a large majority reported little or no change (but not necessarily adequate housing). An index value below neutral (100) suggests respondents overall see a diminishing ability of the existing stock of affordable housing to meet current needs.
A common theme among survey respondents was concern about an insufficient stock of affordable housing in rural areas, especially in areas where workers have traveled from other states to work at large enterprises, mostly meat-packing plants. While the development of new affordable housing units was generally reported to be strong, reduced public spending has limited the ability of some organizations to construct or rehabilitate housing.
In addition to rent relative to income, other factors identified as having kept prospective LMI tenants out of housing include rental standards imposed by landlords (such as restrictions for criminal history, credit history, rental history and income), including for subsidized and otherwise affordable housing developments.
A special question in the latest survey asked respondents to assess the affordability of rental housing in their communities. Responses varied significantly, making a synthesis of these perceptions difficult. Nevertheless, some common themes were expressed. In particular, a large share of survey participants reported that vacancy rates for rental housing are especially low historically. Also common were reports of insufficient quality in rental housing that is affordable. A number of respondents also commented that while rental housing seems to have become less affordable recently, construction of multifamily rental housing is also high.
Analysis of Related External Data
External data at the national level show wide variation across geography in trends in rents, reinforcing the variation in the responses to the special question on rental affordability in the July 2015 LMI Survey.
The “Fair Market Rent” (FMR) in the Denver MSA, which can be interpreted as an average rent, rose at a compound annual rate of 9 percent in 2012-15, or about 30 percent for the three-year period.23 In the last year alone, FMR in the Denver MSA rose more than 20 percent. By contrast, the 2014-15 changes in FMR in most other large Tenth District metro areas were much less steep, ranging from 2.2 percent in the Omaha MSA to 6 percent in the Tulsa MSA.
Within the Tenth District, rental housing is generally more affordable in terms of “housing wage” and affordable available units for low-income households than are similarly situated regions. The housing wage is the (gross) hourly full-time wage needed by a renter to afford a unit at FMR while spending no more than 30 percent of income on housing. This wage, or the income level that generated it, can be used to judge how affordable market rental units are for households by geography and income level.
Colorado has the highest housing wage (two-bedroom unit) in the District at $19.89, just over the national housing wage. It ranks 15th among all states. Other District states have significantly lower housing wages than the national housing wage, ranging between $13.77 in Oklahoma (ranked 43rd) to $14.98 in Wyoming (ranked 31st). Among metropolitan areas in the District, the Boulder ($23.69) and Denver ($22.23) MSAs have relatively high housing wages. Among the District’s largest MSAs, the 2015 housing wages are $17.13 in Kansas City, $14.38 in Oklahoma City, $15.06 in Tulsa and $15.52 in Omaha. At those rates, the number of weekly work hours required to afford rental housing (assuming a one-earner household) at FMR at minimum wage would be 131 in Boulder, 123 in Denver, 95 in Kansas City, 79 in Oklahoma City, 83 in Tulsa and 86 in Omaha.
Access to Credit
The LMI Credit Access Index maintained strength in mid-2015, moving modestly downward to 85.2 from 89.3 at year-end 2014. This result follows a surge in the index in the previous period. A large majority of respondents reported no change in credit conditions for LMI consumers.
The most telling signal of improved credit conditions for LMI consumers is the lack of comments about credit conditions in the most recent survey compared to previously. In particular, there was virtually no comment on mortgage-related credit or alternative financial institutions, such as payday lenders, whereas numerous concerns in these sectors have been expressed previously. An exception is reports on student loan debt. Many survey respondents expressed concerns about increasing student loan debt (assumedly per borrower) and the inability of many of those with student debt, especially among those recently entering repayment, to finance their debt in light of labor market conditions and other costs of living.
Appendix
DIFFUSION INDEXES FOR LOW- AND MODERATE-INCOME INDICATORS
*The author would like to acknowledge the assistance of Mwai Malindi, Research Associate, in preparing this report.
Endnotes
-
1 The Kansas City Fed's biannual survey measures the economic conditions of LMI populations and the organizations that serve them. Survey results are used to construct five indicators of economic conditions in LMI communities and two indicators of conditions faced by organizations that serve them. The goal is to provide service providers, policymakers and others a gauge to assess changes over time in the economic conditions of the LMI population.
-
2 Tabular data are provided in the Appendix.
-
3 The indexes can range from 0 (most deterioration in conditions) to 200 (most improvement in conditions), where a value of 100 is neutral. In this case, a larger share of respondents (28.7 percent) reported that conditions had worsened than reported that they had improved (7 percent), leading to the consensus reading below neutral (7-28.7+100=78.3; see table notes for additional details).
-
4 The LMI Service Needs Index is computed by subtracting the percent of service providers that responded “higher” from the percent of service providers that responded “lower” and adding 100 to show that higher needs translate into lower numbers for the index.
-
5 The U.S. Department of Agriculture defines food deserts as “parts of the country vapid of fresh fruit, vegetables, and other healthful whole foods, usually found in impoverished areas” and asserts that the problem “is largely due to a lack of grocery stores, farmers’ markets, and healthy food providers.” For additional information, see “USDA Defines Food Deserts,” Nutrition Digest, American Nutrition Association, 37(3), available at External Linkhttp://americannutritionassociation.org/newsletter/usda-defines-food-deserts.
-
6 The survey is conducted biannually, but the survey questions ask specifically for perceptions of economic conditions relative to the previous quarter.
-
7 The CPS is a joint effort of the U.S. Bureau of Labor Statistics (BLS) and the U.S. Census Bureau. The monthly survey of about 60,000 occupied U.S. households is the primary source for U.S. labor statistics, including the official unemployment rate. Extensive demographic data also are collected. The response rate of about 90 percent significantly exceeds the rates for most regular U.S. government surveys. For this report, data from individuals’ survey responses were used to tabulate a variety of labor statistics by income group and for the Tenth District. Equivalent U.S. statistics are provided for comparison. The “headline unemployment rate” for states is reported monthly.
-
8 Statistics also were computed for the entire United States over all income classes and other cohorts defined in this report and then compared to similar statistics posted by the BLS to its website. Statistics computed using CPS data were highly consistent with official statistics reported by the BLS. Occasional BLS research often provides more narrowly defined statistics.
-
9 Unemployed workers and households of unemployed workers likely will have some income during the period of unemployment. Especially common is income offered by unemployment insurance, but also through earnings of other household members, public assistance, assistance from family or friends or other sources.
-
10 Causality moves in both directions and is likely much stronger from education to income. Here the term “LMI worker” is used broadly to consist of workers in LMI families or those who live in LMI communities.
-
11 U.S. Bureau of Labor Statistics, Labor Statistics from the Current Population Survey, “Employment status of the civilian non-institutional population 25 years and over by educational attainment, sex, race, and Hispanic or Latino ethnicity” [table]. Retrieved July 23, 2015, from External Linkhttp://www.bls.gov/cps/cpsaat07.htm. Includes those who have earned a General Equivalency Diploma.
-
12 In an effort to address LMI individuals and communities while accounting for the difficulty in disentangling employment and income, these workers are defined as those who live in LMI families.
-
13 The U.S. government began collecting these statistics in 1948.
-
14 The coefficient of correlation for official unemployment rates and long-term unemployment rates for the United States over time is 0.79, demonstrating a strong positive statistical association.
-
15 “LMI occupations” are those with typical requirements for education, training and experience are most typical of LMI workers. For additional information, see the second quarter, 2014 issue of the “Tenth District LMI Labor Force Report."
-
16 For this report, the marginally attached are analyzed as a share of those who are not in the labor force (neither employed nor officially unemployed). A more common way to view the degree of marginal attachment to the labor force is through the BLS U-5 unemployment rate. The U-5 unemployment rate is a measure of the marginally attached as a share of those in the labor force (+ marginally attached).
-
17 Official BLS definition.
-
18 "The marginally attached” statistic is provided rather than the “discouraged” statistic due to a relatively small number of discouraged workers in the working-age population, which, when parsed for this report, yields results of questionable reliability.
-
19 Most commonly, the other “marginally attached” workers had not looked for work in the past four weeks for reasons such as family responsibilities or transportation problems. See “Ranks of Discouraged Workers and Others." Marginally Attached to the Labor Force,” Issues in Labor Statistics, U.S. Department of Labor. Retrieved July 23, 2015, at External Linkhttp://www.bls.gov/opub/btn/archive/ranks-of-discouraged-workers-and-others-marginally-attached-to-the-labor-force-rise-during-recession-pdf.pdf.
-
20 Middle-income individuals (households) have incomes between 80 percent and 120 percent of area median income. Upper-income individuals have incomes greater than 120 percent of area median income.
-
21 “Half of New Graduates Are Jobless or Underemployed,” USA Today, April 23, 2012. Retrieved July 24, 2015, at http://usatoday30.usatoday.com/news/nation/story/2012-04-22/college-grads-jobless/54473426/1. For additional information on the struggles of young adults in securing career-oriented, stable employment, see Martha Ross and others, “Unemployment Among Young Adults: Exploring Employer-Led Solutions, Brookings Institution, July 21, 2015. Retrieved July 29, 2015, at External Linkhttp://www.brookings.edu/research/reports/2015/07/21-unemployment-young-adults-ross-gatz-kazis-ng-svajlenka.
-
22 An alternative would be to ask about the affordability of rental housing more generally, which is a very different question. An extensive report on the affordability of rental housing is in progress at the Kansas City Fed.
-
23 “Fair Market Rents” (FMR) are a commonly measure of typical home rental rates across U.S. geographies published by the U.S. Department of Housing and Urban Development (HUD). FMRs are computed primarily to determine payment standard amounts for the Housing Choice Voucher program and several other assisted housing programs. Additionally, FMRs typically are used in rental housing affordability computations. FMRs include shelter rent plus the cost of all tenant-paid utilities, except telephone, television and Internet services. The level at which FMRs are set is expressed as a percentile point within the rent distribution of standard-quality rental housing units. The current definition used is the 40th percentile. Fair Market Rents are available from HUD at External Linkhttp://www.huduser.org/portal/datasets/fmr.html.
The views expressed are those of the authors and do not necessarily reflect the positions of the Federal Reserve Bank of Kansas City or the Federal Reserve System.