Summary of Quarterly Indicators
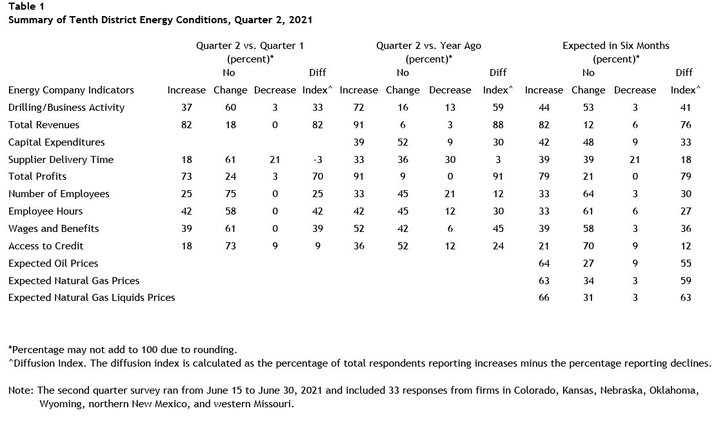
Tenth District energy activity continued to increase steadily in the second quarter of 2021 and also outpaced year ago levels, as indicated by firms contacted between June 14th and June 30st, 2021 (Tables 1 & 2). The drilling and business activity index remained mostly unchanged at 33 (Chart 1). Total revenues and profits indexes posted their highest levels since the survey began in 2014. In addition, employment, employee hours, access to credit, and wages and benefits indexes increased from the previous quarter.
Chart 1. Drilling/Business Activity Index vs. a Quarter Ago
Skip to data visualization table| Date | Vs a Quarter Ago | Vs a Year Ago |
|---|---|---|
| Q2 17 | 43 | 70 |
| Q3 17 | 7 | 44 |
| Q4 17 | 13 | 54 |
| Q1 18 | 37 | 54 |
| Q2 18 | 26 | 41 |
| Q3 18 | 45 | 57 |
| Q4 18 | -13 | 17 |
| Q1 19 | 0 | 17 |
| Q2 19 | 7 | -11 |
| Q3 19 | -23 | -21 |
| Q4 19 | -48 | -50 |
| Q1 20 | -81 | -92 |
| Q2 20 | -61 | -70 |
| Q3 20 | 4 | -71 |
| Q4 20 | 40 | -60 |
| Q1 21 | 34 | 10 |
| Q2 21 | 33 | 59 |
Year-over-year indexes continued to increase from the previous survey. The year-over-year drilling and business activity index moved from 10 to 59. Nearly all other indexes were also higher than the previous reading, with the exception of supplier delivery time, which decreased from 7 to 3.
Most expectations indexes continued to increase in Q2 2021. The future drilling and business activity index, at 41, was up from 40 in Q1 and 26 in Q4 2020, indicating slightly more firms expected energy activity to expand. The revenues and profits indexes rose substantially, and expectations for employment, supplier delivery time, and access to credit also expanded. Price expectations for oil, natural gas, and natural gas liquids expanded at a moderately faster pace.
Summary of Special Questions
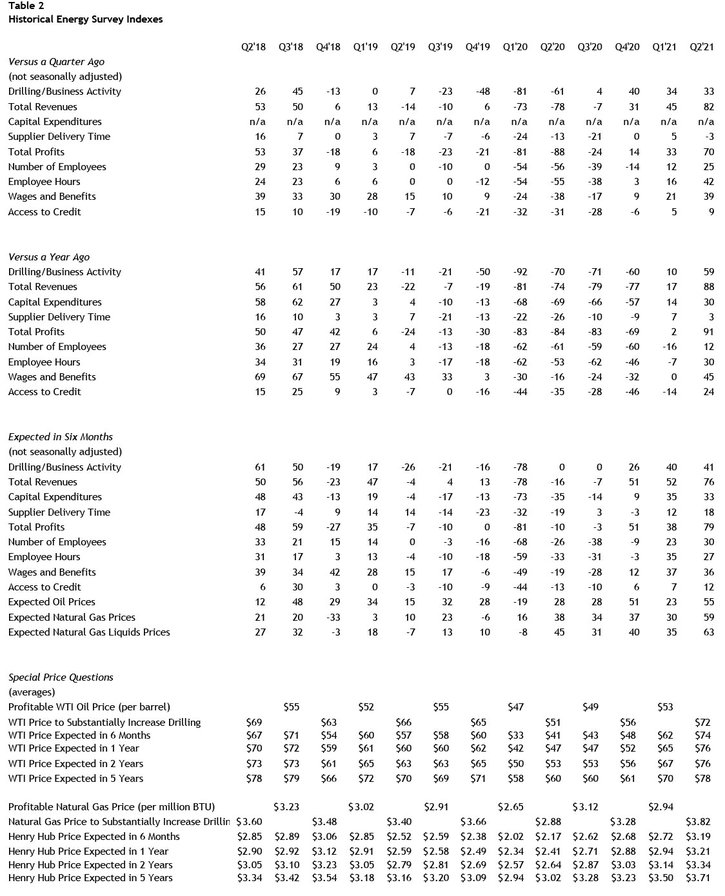
This quarter firms were asked what oil and natural gas prices were needed on average for a substantial increase in drilling to occur across the fields in which they are active (in alternate quarters they are asked what prices are needed for drilling to be profitable). The average oil price needed was $72 per barrel, with a range of $35 to $80 (Chart 2). This average was considerably higher than prices needed to substantially increase drilling the past few years. The average natural gas price needed was $3.82 per million Btu, with responses ranging from $2.00 to $7.00.
Chart 2. Special Question - What price is currently needed to substantially increase drilling for oil and natural gas, and what do you expect the WTI and Henry Hub prices to be in six months, one year, two years, and five years?
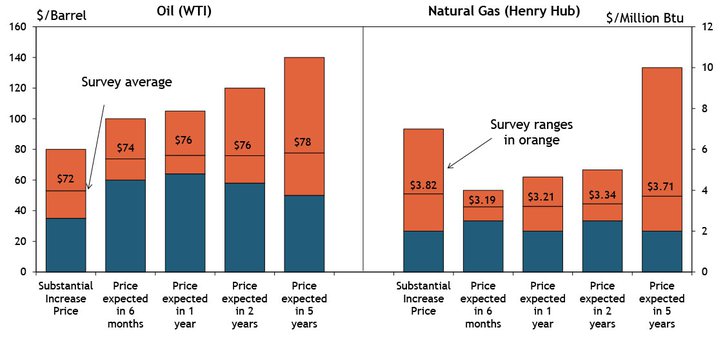
Firms were again asked what they expected oil and natural gas prices to be in six months, one year, two years, and five years. Overall, expected oil and natural gas prices were higher than previous price expectations in 2020. The average expected WTI prices were $74, $76, $76, and $78 per barrel, respectively. The average expected Henry Hub natural gas prices were $3.19, $3.21, $3.34, and $3.71 per million Btu, respectively.
Firms were also asked about growth constraints (Chart 3). Around 36% of firms indicated uncertainty about the future of oil and gas prices, with 13% of firms reporting issues finding workers, supply chain disruptions, and lack of access to capital as reasons for limited growth.
Chart 3. Which of the following is the main constraint that is limiting near-term growth in activity in the top area in which your firm is active?
Skip to data visualization table| Which of the following is the main constraint that is limiting near-term growth in activity in the top area in which your firm is active? | Percent |
|---|---|
| Uncertainty about future oil and/or natural gas prices | 35.48387 |
| Problems finding workers | 12.90323 |
| Supply chain disruptions and/or availability of materials or equipment | 12.90323 |
| Limited access to capital and credit | 12.90323 |
| Current oil and/or natural gas prices | 9.677419 |
| Pipeline capacity constraints | 6.451613 |
| Other | 12.90323 |
Additionally, firms were asked about investment in labor saving technology (Chart 4). Approximately 10% of firms reported investments at a faster pace than in the past, with 32% indicating similar investments as in previous years. Around 10% of businesses said they were investing at a slower pace than before, and 48% had not planned any investment in labor saving technology.
Chart 4. Special Question - Because of labor shortages, has your firm invested or plan to invest in labor-saving automation strategies?
Skip to data visualization table| Because of labor shortages, has your firm invested or plan to invest in labor-saving automation strategies? | Percent |
|---|---|
| Yes but similar to the past | 32.25806 |
| Yes at a faster pace than in the past | 9.677419 |
| Yes but at a slower pace than in the past | 9.677419 |
| No we have not invested in labor-saving technology | 48.3871 |
Selected Energy Comments
“Demand growth should be sharper in the near-term then low long-term. Supply can keep up in the near term but may not keep up longer term.”
“Companies will respond to higher prices and subsequently prices will go down as more production comes online.”
“Capital constraints in the hydrocarbon production space will begin to have a negative effect on supply of crude and natural gas.”
“There will be a medium-term supply crunch, with improving demand. Slow reaction by producers to grow meaningfully. The long-term marginal supply will be like in the mid 50's.”
“It is possible we could see $100/bbl in 6 months if travel on the road and in the air picks up globally. But those prices could also impact demand.”
Additional Resources
The views expressed are those of the authors and do not necessarily reflect the positions of the Federal Reserve Bank of Kansas City or the Federal Reserve System.
Author