Summary of Quarterly Indicators
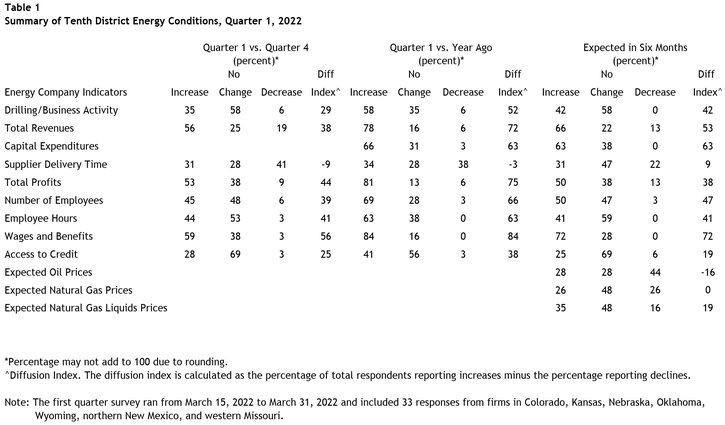
Tenth District energy activity increased moderately in the first quarter of 2022, as indicated by firms contacted between March 15th, 2022, and March 31st, 2022 (Tables 1 & 2). The drilling and business activity index eased slightly from 32 to 29 but remained relatively high by historical standards, indicating solid expansion (Chart 1). The indexes for employment, wages and benefits, and access to credit reached their highest levels since the survey began in 2014. The index for profits also remained elevated, while the pace of growth for revenues slowed slightly and supplier delivery time declined.
Chart 1. Drilling/Business Activity Index vs. a Quarter Ago
Skip to data visualization table| Quarter | Vs. a Quarter Ago | Vs. a Year Ago |
|---|---|---|
| Q1 18 | 37 | 54 |
| Q2 18 | 26 | 41 |
| Q3 18 | 45 | 57 |
| Q4 18 | -13 | 17 |
| Q1 19 | 0 | 17 |
| Q2 19 | 7 | -11 |
| Q3 19 | -23 | -21 |
| Q4 19 | -48 | -50 |
| Q1 20 | -81 | -92 |
| Q2 20 | -62 | -70 |
| Q3 20 | 4 | -71 |
| Q4 20 | 40 | -60 |
| Q1 21 | 35 | 12 |
| Q2 21 | 33 | 59 |
| Q3 21 | 43 | 68 |
| Q4 21 | 32 | 74 |
| Q1 22 | 29 | 52 |
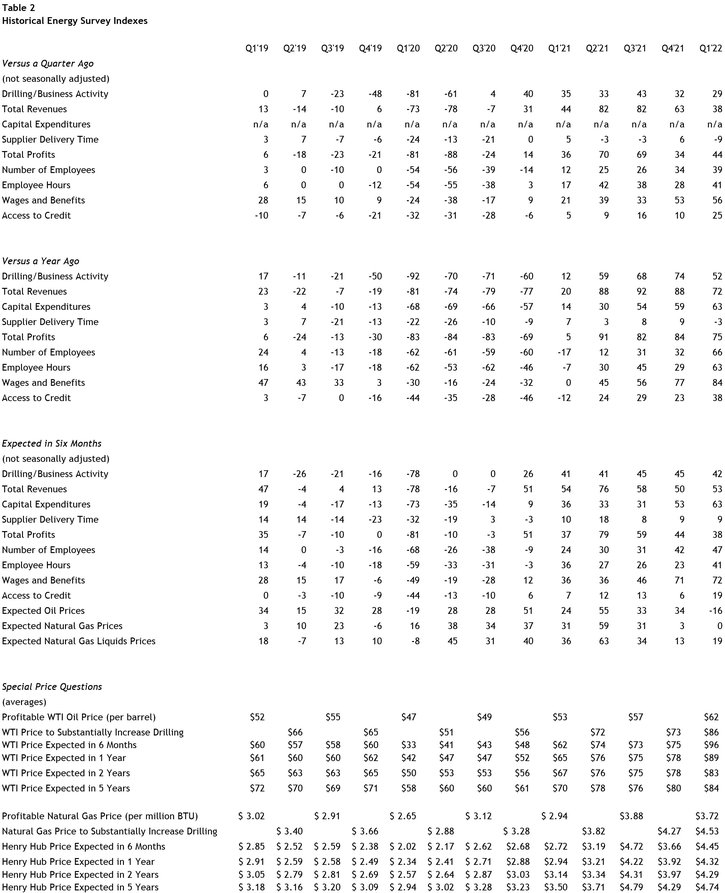
Year-over-year indexes were mixed compared with the previous survey. The year-over-year drilling and business activity index declined moderately from 74 to 52. The rate of growth also dipped for the revenues and profits indexes, and the supplier delivery time index decreased. However, the year-over-year capital expenditures index was at its highest level since 2018, and the employment, wages and benefits, and access to credit indexes posted record highs.
Expectations for future activity remained strong in Q1 2022. The future drilling and business activity index inched down from 45 to 42, while expectations for future employment, capital spending, wages and benefits, and access to credit continued to increase. Price expectations for oil were lower compared to current prices. Expectations for natural gas prices were relatively flat, while natural gas liquids prices were expected to increase moving forward.
Summary of Special Questions
This quarter firms were asked what oil and natural gas prices were needed on average for drilling to be profitable across the fields in which they are active. The average oil price needed was $62 per barrel, while the average natural gas price needed was $3.72 per million Btu. Firms were also asked what prices were needed for a substantial increase in drilling to occur across the fields in which they are active. The average oil price needed was $86 per barrel, with a range of $45 to $150 (Chart 3). The average natural gas price needed was $4.53 per million Btu, with responses ranging from $3.00 to $6.50. Overall, firms reported the highest prices needed to be profitable and increase drilling in survey history (since 2014).
Chart 2. Special Question - What price is currently needed for a drilling to be profitable and for a substantial increase in drilling to occur for oil? What do you expect WTI prices to be in six months, one year, two years, and five years?
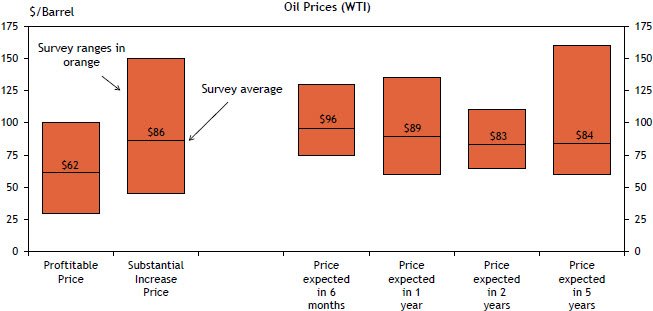
Chart 3. Special Question - What price is currently needed for a drilling to be profitable and for a substantial increase in drilling to occur for natural gas? What do you expect Henry Hub prices to be in six months, one year, two years, and five years?
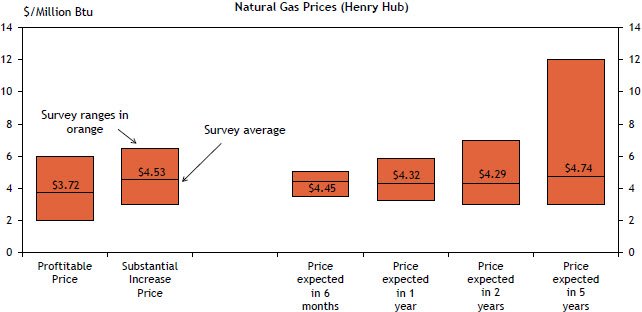
Firms were also asked what they expected oil and natural gas prices to be in six months, one year, two years, and five years. Oil price expectations again surpassed survey records. The average expected WTI prices were $96, $89, $83, and $84 per barrel, respectively. In contrast, price expectations for natural gas declined. The average expected Henry Hub natural gas prices were $4.45, $4.32, $4.29, and $4.74 per million Btu, respectively.
Energy firms were also asked about their key constraints to production growth (Chart 4). Firms ranked difficulty finding labor, investor pressure to maintain capital discipline, price uncertainty, and supply chain issues as primary items restraining growth. Still, on average, firms planned to increase production 7.5% by Q4 2022.
Chart 4. Special Question - Which of the following are the top reasons restraining growth for your firm despite high oil prices? (please rank your top three from most to least impactful)
Skip to data visualization table| Constraints | Rank 1 | Rank 2 | Rank 3 |
|---|---|---|---|
| Difficulty finding labor | 8 | 4 | 3 |
| Investor pressure to maintain capital discipline | 7 | 2 | 3 |
| Price uncertainty | 5 | 5 | 5 |
| Supply chain issues/lack of materials | 4 | 6 | 5 |
| Regulatory concerns | 2 | 4 | 6 |
| Delayed maintenance/insufficient equipment | 2 | 3 | 0 |
| Lack of access to financing | 0 | 2 | 0 |
| Other | 1 | 0 | 0 |
In addition, firms were asked about well productivity (Chart 5). Around 52% of firms reported a slight increase in U.S. well productivity over the course of the pandemic, with nearly 30% of firms reporting slight or significant decreases and over 18% of firms reporting no change. Moving forward, 14% of firms expected a significant increase in productivity, and 48% expected a slight increase. However, 24% expected no change, and 14% expected a slight decrease in productivity in 2022.
Chart 5. Special Question - How has U.S. well productivity changed over the course of the pandemic? How do you expect productivity to change in 2022?
Skip to data visualization table| Response | How has U.S. well productivity changed over the course of the pandemic? | How do you expect productivity to change in 2022? |
|---|---|---|
| Significant increase | 0 | 13.8 |
| Slight increase | 51.9 | 48.3 |
| No change | 18.5 | 24.1 |
| Slight decrease | 18.5 | 13.8 |
| Significant decrease | 11.1 | 0 |
Selected Energy Comments
“The world oil price is currently in turmoil due to the Russian war on Ukraine, the negotiations with Iran and other outages and factors such as COVID resurgence in China. We expect higher prices until some clarity is reached on several of these issues. Expect high volatility to continue.”
“The biggest factor is global demand and the ability for the US to continue expanding liquefaction capacities. If progress is made on that front, higher prices could be in order [for natural gas].”
“[Over the course of the pandemic], more disciplined use of capital along with adding extra overtime now instead of adding people.”
“The extended years of low crude oil prices has killed the drilling business.”
“[Over the course of the pandemic] technology in fracturing keeps becoming more efficient.... We are beginning to drill and complete our second-tier locations, with a bit of trepidation. I do not believe we will see the big percentage increase year over year as happened this past decade.”
“[Over the course of the pandemic], the rising cost to drill & complete have operators revaluating this cost to justify drilling. Smaller independents are having a difficult time attracting new investors.”
“[The Russia/Ukraine conflict] reduced our willingness to hedge due to increased risk of sharp price spikes.”
"We have historically not hedged but recent events [Russia/Ukraine conflict] have caused us to do some evaluation.”
Additional Resources
The views expressed are those of the authors and do not necessarily reflect the positions of the Federal Reserve Bank of Kansas City or the Federal Reserve System.
Author