Summary of Quarterly Indicators
Tenth District energy activity expanded moderately in the fourth quarter of 2020 but continued to lag year ago levels, as indicated by firms contacted between December 15 and December 31, 2020 (Tables 1 & 2). The drilling and business activity index rose significantly from 4 to 40 (Chart 1). Total revenues, profits, employee hours, and wages and benefits indexes rebounded back into positive territory. However, employment and access to credit indexes remained negative, indicating contraction in Q4 2020.
Chart 1
Drilling/Business Activity Index vs. a Quarter Ago
Skip to data visualization table| Date | Drilling/Business Activity |
|---|---|
| 2017Q1 | 55 |
| 2017Q2 | 43 |
| 2017Q3 | 7 |
| 2017Q4 | 13 |
| 2018Q1 | 37 |
| 2018Q2 | 26 |
| 2018Q3 | 45 |
| 2018Q4 | -13 |
| 2019Q1 | 0 |
| 2019Q2 | 7 |
| 2019Q3 | -23 |
| 2019Q4 | -48 |
| 2020Q1 | -81 |
| 2020Q2 | -61 |
| 2020Q3 | 4 |
| 2020Q4 | 40 |
Year-over-year indexes were still negative in Q4 2020. The year-over-year drilling and business activity index moved from -71 to -60 in Q4. Indexes for employment, wages and benefits, and access to credit declined at a faster rate in Q4. On the other hand, the indexes for total revenues, capital expenditures, delivery time, profits, and employee hours were less negative than last quarter.
Expectations indexes increased, jumping back to positive for the first time since Q1 2019. The future drilling and business activity index was 26, up from 0 in Q2 and Q3 2020, indicating more firms expected energy activity to expand. The future total revenues and total profits indexes rose substantially, and expectations for capital expenditures, wages and benefits, and access to credit also expanded. However, future indexes for delivery time, employment, and employee hours remained negative. Price expectations for oil, natural gas, and natural gas liquids increased further in Q4 2020.
Summary of Special Questions
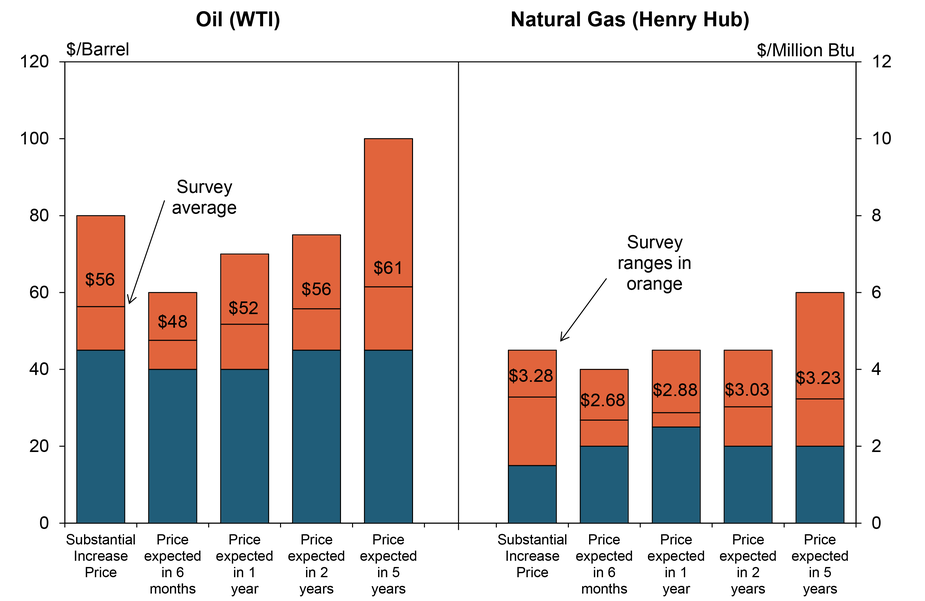
This quarter firms were asked what oil and natural gas prices were needed for a substantial increase in drilling to occur on average across the fields in which they are active (in alternate quarters they are asked what prices are needed to be profitable). The average oil price needed was $56 per barrel, with a range of $45 to $80 (Chart 2). This average was higher than prices needed to substantially increase drilling in Q2 2020, but still lower than prices for the past several years. The average natural gas price needed was $3.28 per million Btu, with responses ranging from $1.50 to $4.50.
Chart 2. Special Question - What price is currently needed to substantially increase drilling for oil and natural gas, and what do you expect the WTI and Henry Hub prices to be in six months, one year, two years, and five years?
Source: Federal Reserve Bank of Kansas City
Firms were again asked what they expected oil and natural gas prices to be in six months, one year, two years, and five years. Overall, expected oil and natural gas prices were higher than previous price expectations in 2020. The average expected WTI prices were $48, $52, $56, and $61 per barrel, respectively. The average expected Henry Hub natural gas prices were $2.68, $2.88, $3.03, and $3.23 per million Btu, respectively.
Firms were also asked about environmental operations (Chart 3). 45% of firms indicated they plan to reduce CO2 or ethane emissions. Additionally, 42% of firms plan to recycle/reuse water and nearly a third plan to reduce flaring of excess product. In contrast, 42% of firms did not have one of the plans listed to curb emissions or reuse water. Regardless of environmental plan, 86% of firms anticipated higher regulatory costs in the upcoming year.
Additionally, firms were again asked about their expectations for global oil demand (Chart 4). Taking into account the global pandemic, over 70% of firms expected that global oil demand would peak sometime beyond 2025. Around 9% of firms anticipated global oil demand has already peaked or will peak within the next two years, and another 21% expect global oil demand to peak between 2023-2025.
Chart 3.
Special Question - Which of the following plans does your firm have? (Check all that apply)
Skip to data visualization table| Plans | Percent |
|---|---|
| Plan to reduce CO2 emissions | 45.16129032 |
| Plan to reduce ethane emissions | 45.16129032 |
| Plan to recycle/reuse water | 41.93548387 |
| Plan to reduce flaring | 32.25806452 |
| None of the above | 41.93548387 |
Chart 4.
Special Question - Taking into account the global pandemic, when does your firm expect global demand for oil to peak?
Skip to data visualization table| Date | Percent |
|---|---|
| 2020-2022 | 8.823529 |
| 2023-2025 | 20.58824 |
| Beyond 2025 | 70.58824 |
Table 1 - Summary of Tenth District Energy Conditions, Quarter 4, 2020

Source: Federal Reserve Bank of Kansas City
Table 2 - Historical Energy Survey Indexes

Source: Federal Reserve Bank of Kansas City
Selected Comments
“COVID-19 and the spring of 2020 price war has accelerated a decline in US shale production growth. COVID recovery and resulting demand growth coupled with ordinary demand growth will increase pressures on supply.”
“There is an up-tick in global demand from the COVID vaccine. Also, there are less oil and gas companies today than 5 years ago. I believe U.S. [oil] production will stay flat over the next few years.”
“Need world demand to get back to normal so inventories can be reduced. Then drilling picks up and drives supply up over next couple years while world tries to push away from fossil fuels and demand flattens.”
“Current [natural gas] activity will not provide enough volume to meet post-COVID-19 demand recovery. Over time the demand will be met, returning price to current levels.”
“With a successful vaccine deployment, oil demand will recover through 2021 with full recovery and return to growth by mid-2022.”
“We will have a quick turn-around in the economy once the vaccine is widely distributed.”
“Population growth, economic improvements, and lifestyle choices in the emerging markets will continue to drive oil demand beyond 2025.”
“Renewable fuels and electric vehicles will impact peak global demand for oil.”
“We think there is enough momentum in the call for renewables that oil demand will peak sooner than later.”
“Developing world demand growth and general global population growth will offset source switching to other energy sources.”
“The world is awash in oil and don't see any change UNLESS global economies pick up significantly.”
“We will continue to build assets and will sacrifice short term profits.”
Additional Resources
The views expressed are those of the authors and do not necessarily reflect the positions of the Federal Reserve Bank of Kansas City or the Federal Reserve System.
Author