Summary of Quarterly Indicators
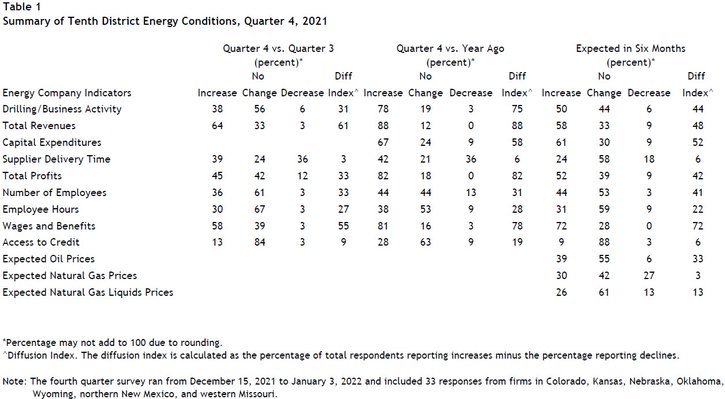
Tenth District energy activity expanded moderately in the fourth quarter of 2021 and continued to outpace year ago levels, as indicated by firms contacted between December 15th, 2021 and January 3rd, 2022 (Tables 1 & 2). The drilling and business activity index moved from 39 to 31, with positive levels indicating expansion (Chart 1). The total revenues index remained elevated, and the wages and benefits index rose to a new survey record high. Supplier delivery time inched up while access to credit growth eased.
Chart 1. Drilling/Business Activity Index vs. a Quarter Ago
Skip to data visualization table| Quarter | Vs. a Quarter Ago | Vs. a Year Ago |
|---|---|---|
| Q4 17 | 13 | 54 |
| Q1 18 | 37 | 54 |
| Q2 18 | 26 | 41 |
| Q3 18 | 45 | 57 |
| Q4 18 | -13 | 17 |
| Q1 19 | 0 | 17 |
| Q2 19 | 7 | -11 |
| Q3 19 | -23 | -21 |
| Q4 19 | -48 | -50 |
| Q1 20 | -81 | -92 |
| Q2 20 | -61 | -70 |
| Q3 20 | 4 | -71 |
| Q4 20 | 40 | -60 |
| Q1 21 | 34 | 10 |
| Q2 21 | 33 | 59 |
| Q3 21 | 39 | 69 |
| Q4 21 | 31 | 75 |
Year-over-year indexes increased further from the previous survey. The year-over-year drilling and business activity index rose from 69 to 75. The indexes for capital expenditures, employment, and wages and benefits all indicated higher levels than a year ago. The revenues and profits indexes also remained very high. However, supplier delivery times remained higher than a year ago for a small share of firms.
Expectations indexes remained positive in Q4 2021. The future drilling and business activity index eased from 46 in Q3 2021 to 44 but was above the Q2 posting of 41. Future employment expectations rose to the highest levels in over 6 years, and expectations for future wages and benefits set a survey record. Expectations for capital spending increased while supplier delivery time expectations remained subdued. Price expectations for oil remained high, while expectations for natural gas and natural gas liquids price growth slowed from a quarter ago.
Summary of Special Questions
This quarter firms were asked what oil and natural gas prices were needed on average for a substantial increase in drilling to occur across the fields in which they are active (in alternate quarters they are asked what prices are needed to be profitable). The average oil price needed was $73 per barrel, with a range of $50 to $100 (Chart 2). The average natural gas price needed was $4.27 per million Btu, with responses ranging from $2.00 to $8.00. The substantial increase price average for oil was the highest level reported since Q2 2015, and the highest ever recorded substantial increase price for natural gas (since 2015).
Chart 2. Special Question - What price is currently needed to substantially increase drilling for oil and natural gas, and what do you expect the WTI and Henry Hub prices to be in six months, one year, two years, and five years?
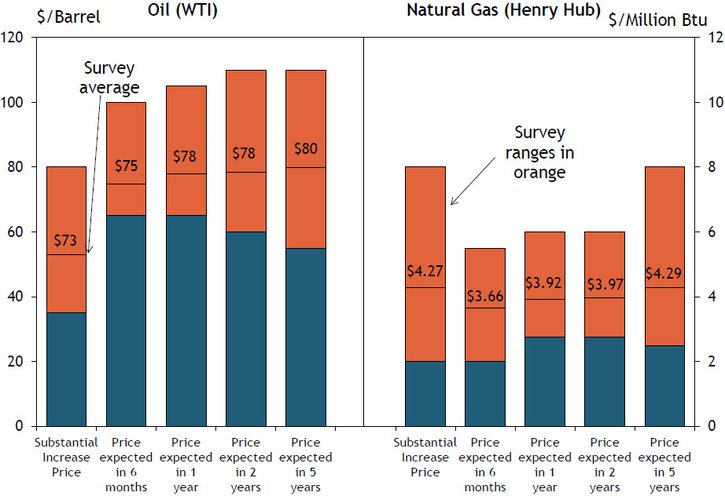
Firms were again asked what they expected oil and natural gas prices to be in six months, one year, two years, and five years. Oil price expectations increased to the highest levels since the survey began this question in 2017. The average expected WTI prices were $75, $78, $78, and $80 per barrel, respectively. In contrast, price expectations for natural gas declined. The average expected Henry Hub natural gas prices were $3.66, $3.92, $3.97, and $4.29 per million Btu, respectively.
Firms were also asked about capital spending plans (Chart 3). Nearly 20% of firms expected capital spending in 2022 to increase significantly compared to 2021, while another 50% expected slight increases. Only 6% of firms expected capital spending to decline. Around a quarter of firms expected 2022 capital spending to remain close to 2021 levels. Several firms reported that inflation has driven higher capital spending costs from services and materials. Other contacts reported increased capital spending plans to expand drilling and production.
Chart 3. Special Question - What are your expectations for your firm's capital spending plans in 2022 vs. 2021?
Skip to data visualization table| Answer | Percent |
|---|---|
| Increase significantly | 18.75 |
| Increase slightly | 50 |
| Remain close to 2021 levels | 25 |
| Decrease slightly | 3.125 |
| Decrease significantly | 3.125 |
Additionally, firms were asked about environmental plans (Chart 4). 45% of firms indicated they plan to reduce carbon dioxide emissions, 41% plan to reduce methane emissions, 28% plan to recycle/reuse water, and 21% plan to reduce flaring. Another 38% of firms indicated they did not have any of the plans listed.
Chart 4. Special Question - Which of the following plans does your firm have? (check all that apply)
Skip to data visualization table| Response | Percent |
|---|---|
| Plan to reduce CO2 emissions | 44.82759 |
| Plan to reduce methane emissions | 41.37931 |
| Plan to reduce flaring | 20.68966 |
| Plan to recycle/reuse water | 27.58621 |
| None of the above | 37.93103 |

Selected Energy Comments
“There will be a need for fossil fuels for a prolonged period due to the incredibly high costs of transition to other forms of energy. Fossil fuels are still plentiful and relatively inexpensive.”
“There is not enough investment for replacement barrels [of oil]. Supply may shrink and demand will stay similar or even grow.”
“Not enough new reserves are being drilled to replace existing production.”
“Inflation is hitting the equipment purchases for new wells.”
“If demand picks up from drop in covid cases, I think oil prices [will increase] within a few months. Then demand destruction kicks in and more EVs are sold and by mid to end of decade we see gasoline demand actually start to plateau and even drop.”
“Expect prices to remain steady due to supply constraints resulting from underinvestment coupled with disproportionate demand increase.”
“Plenty of gas in the USA; European and Asian demand will fall off significantly.”
“Inability to permit enough LNG to balance the market in the US. Persistent disparity between US and global spot prices.”
“Gas will be favored internationally for its cleaner footprint. Underspending will keep prices up.”
“We will pay cash for all our [capital expenditures].”
“OPEC + overhang and demand uncertainties suggest neutral to moderate approach to growth.”
“2021 was catch up for lack of [capital] spending in 2020. We've added "have to have or too good to pass up" assets to our inventory, now it's plow ahead and save.”
“Pressure to moderate spending from investors.”
Additional Resources
The views expressed are those of the authors and do not necessarily reflect the positions of the Federal Reserve Bank of Kansas City or the Federal Reserve System.
Author