Summary of Quarterly Indicators
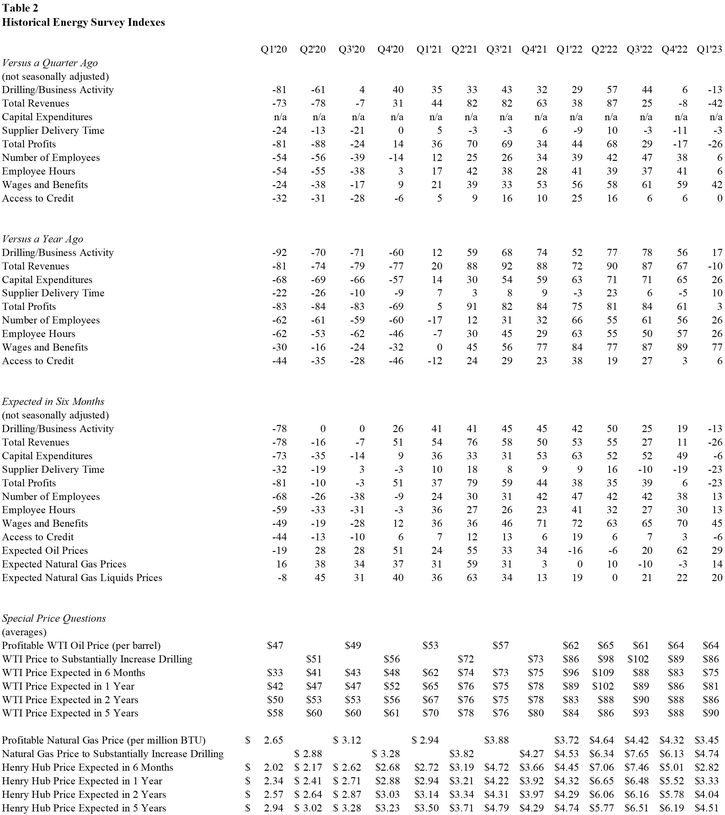
Tenth District energy activity declined moderately in the first quarter of 2023, as indicated by firms contacted between March 15th, 2023, and March 31st, 2023 (Tables 1 & 2). The drilling and business activity index decreased from 6 to -13 (Chart 1). All other indexes decreased from previous readings, except the supplier delivery time index increased from -11 to -3.
Chart 1. Drilling/Business Activity Index vs. a Quarter Ago
Skip to data visualization table| Quarter | Vs. a Quarter Ago | Vs. a Year Ago |
|---|---|---|
| Q1 19 | 0 | 17 |
| Q2 19 | 7 | -11 |
| Q3 19 | -23 | -21 |
| Q4 19 | -48 | -50 |
| Q1 20 | -81 | -92 |
| Q2 20 | -62 | -70 |
| Q3 20 | 4 | -71 |
| Q4 20 | 40 | -60 |
| Q1 21 | 35 | 12 |
| Q2 21 | 33 | 59 |
| Q3 21 | 43 | 68 |
| Q4 21 | 32 | 74 |
| Q1 22 | 29 | 52 |
| Q2 22 | 57 | 77 |
| Q3 22 | 44 | 78 |
| Q4 22 | 6 | 56 |
| Q1 23 | -13 | 17 |
Year-over-year indexes remained mixed. The year-over-year indexes for drilling/business activity, capital expenditures, total profits, number of employees, employee hours, and wages and benefits all cooled but remained in positive territory. The total revenues index declined substantially from 67 to -10. However, the supplier delivery time and access to credit indexes increased.
Expectations for future activity also decreased moderately in Q1 2023. The future drilling and business activity index fell from 19 to -13, and expectations for future revenues and profits declined significantly. Price expectations for oil fell slightly, and expectations for natural gas prices decreased substantially.
Summary of Special Questions
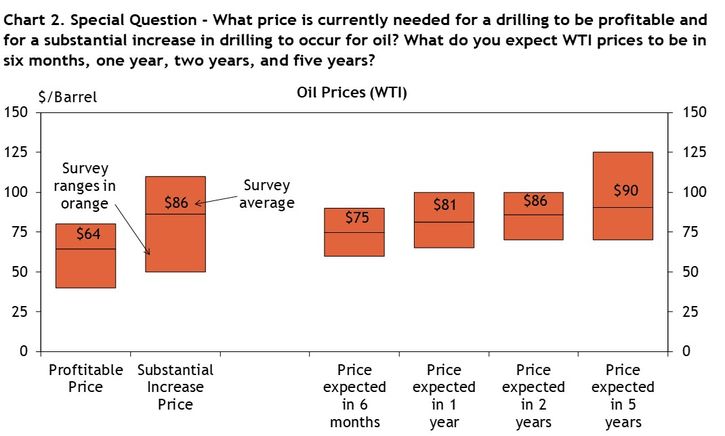
Firms were asked what oil and natural gas prices were needed on average for drilling to be profitable across the fields in which they are active. The average oil price needed was $64 per barrel, while the average natural gas price needed was $3.45 per million Btu (Chart 2). Firms were also asked what prices were needed for a substantial increase in drilling to occur across the fields in which they are active. The average oil price needed was $86 per barrel, and the average natural gas price needed was $4.74 per million Btu, (Chart 3).
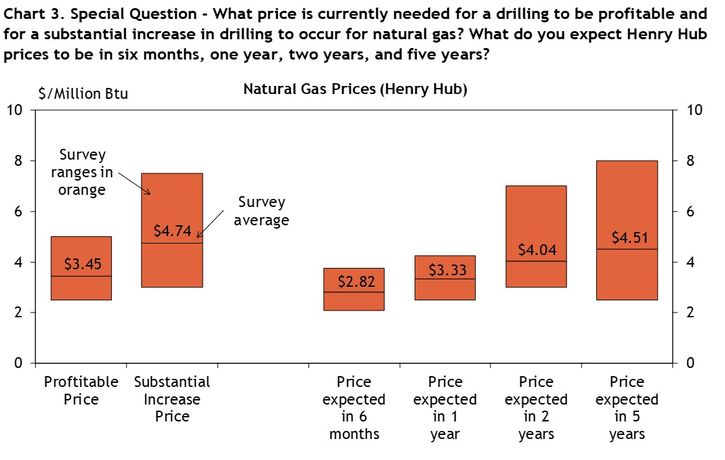
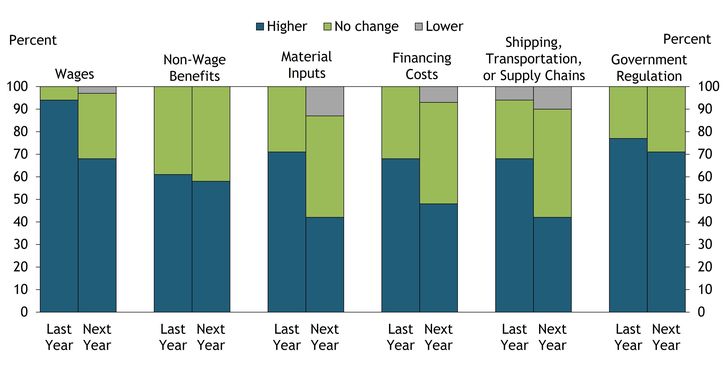
Firms reported what they expected oil and natural gas prices to be in six months, one year, two years, and five years. The average expected WTI prices were $75, $81, $86, and $90 per barrel, respectively. The average expected Henry Hub natural gas prices were $2.82, $3.33, $4.04, and $4.51 per million Btu, respectively. Energy firms were also asked how their input costs changed over the last year, and how they anticipate they will change over the next year (Chart 4). A majority of firms reported their costs increased in all categories (wages; non-wage benefits; material inputs; financing costs; shipping, transportation, or supply chains; and government regulation) over the last year. However, a majority of firms anticipate that material inputs, financing costs, and shipping, transportation, or supply chain costs will either be lower or the same in the coming year.
Chart 4. Special Question - How have your firms costs changed in the following categories over the last year, and how do you anticipate they will change over the next year?
In addition, firms were asked how they expect their number of employees to change from December 2022 to December 2023 (Chart 5). Slightly over half of firms reported they expect the number of employees to remain the same, 39% expect a slight increase, 6% expect a slight decrease, and 3% expect the number to increase significantly.
Chart 5. Special Question - How do you expect the number of employees at your company to change from December 2022 to December 2023?
Skip to data visualization table| Response | Percent |
|---|---|
| Increase significantly | 3.23 |
| Increase slightly | 38.71 |
| Reamin the same | 51.61 |
| Decrease slightly | 6.45 |
| Decrease significantly | 0.0 |
| No opinion/don't know | 0.0 |
Table 1
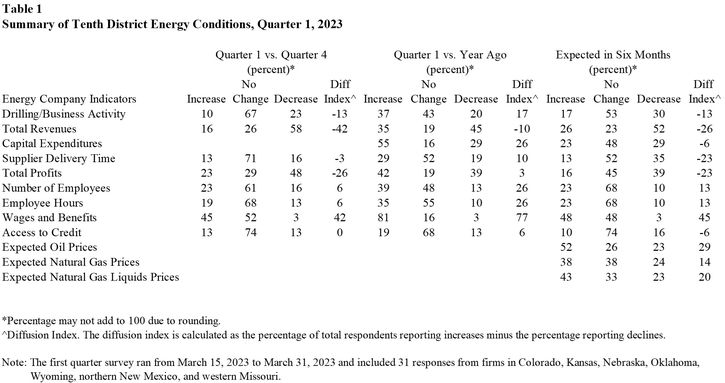
Table 2
Selected Energy Comments
“A lot of uncertainty with the price of oil. Operators are taking a pause to see how the next 3-4 months play out. Drilling for gas isn't even part of the conversation. We continue to hear from operators that steel/casing cost are still too high with availability limited.”
“As rigs continue to go down we have to retain our crews. We've worked so hard to find good help, if we lose them now they'll never come back. I'm paying reduced wages with no OT to 70% of my personnel to work in our drilling yard on equipment maintenance. With declining revenues & income it's all about preserving capital.”
“We have cut back drilling to offset higher costs and lower revenue to maintain a stable to increasing free cash flow position.”
“Natural gas markets are oversupplied and there will be nowhere to go with gas until producers pinch back 400 bcf to get storage back in balance.”
“Service costs are currently at a rate in excess of today's commodity prices. Therefore, an absence of service cost decreases would be damaging.”
“Fluctuations in oil prices driven by the conflicting inflationary environment and potential recession are making it difficult to plan business over the next 6 months. We expect softness in the gas market due to sub $3 gas. TBD on whether oil basins can absorb the excess capacity. Weakness in overall activity and resulting pricing softness could lead to headcount and capex reductions.”
“Not a lot of quality deals and few investment dollars especially for the smaller independents. Very little new entry into our market combined with an aging and/or retirement from the older operators.”
“Appears to be no risk premium in oil prices. While fundamentals for crude have been bearish lately, it does not appear that product demand has softened a great deal, and inventories of products remain tight.”
Additional Resources
The views expressed are those of the authors and do not necessarily reflect the positions of the Federal Reserve Bank of Kansas City or the Federal Reserve System.
Authors

Chad Wilkerson
Senior Vice President and Oklahoma City Branch Executive