Summary of Quarterly Indicators
Tenth District energy activity accelerated in the third quarter of 2021 and continued to outpace year ago levels, as indicated by firms contacted between September 15th and September 30th, 2021 (Tables 1 & 2). The drilling and business activity index rose from 33 to 39 (Chart 1). Total revenues and profits indexes remained near the survey record highs posted in Q2 2021. Access to credit expanded from the previous quarter, while supplier delivery time remained negative.
Chart 1. Drilling/Business Activity Index vs. a Quarter Ago
Skip to data visualization table| Date | Vs. a Quarter Ago | Vs. a Year Ago |
|---|---|---|
| Q3 17 | 7 | 44 |
| Q4 17 | 13 | 54 |
| Q1 18 | 37 | 54 |
| Q2 18 | 26 | 41 |
| Q3 18 | 45 | 57 |
| Q4 18 | -13 | 17 |
| Q1 19 | 0 | 17 |
| Q2 19 | 7 | -11 |
| Q3 19 | -23 | -21 |
| Q4 19 | -48 | -50 |
| Q1 20 | -81 | -92 |
| Q2 20 | -61 | -70 |
| Q3 20 | 4 | -71 |
| Q4 20 | 40 | -60 |
| Q1 21 | 34 | 10 |
| Q2 21 | 33 | 59 |
| Q3 21 | 39 | 69 |
Year-over-year indexes increased from the previous survey. The year-over-year drilling and business activity index grew from 59 to 69. The indexes for revenues, capital expenditures, supplier delivery time, employees, employee hours, wages and benefits, and access to credit rose at a faster pace in Q3 2021 compared to a year ago. Profits remained very high but grew at a slightly slower rate from the previous reading.
Expectations indexes continued to expand in Q3 2021. The future drilling and business activity index, at 46, was up from 41 in Q2, indicating additional firms expected energy activity to expand. Future revenues and profits indexes remained very high, and expectations for wages and benefits increased. Price expectations for oil, natural gas, and natural gas liquids were positive, but expectations for the pace of price growth was slower than a quarter ago given the rapid increase in prices recently.
Summary of Special Questions
This quarter firms were asked what oil and natural gas prices were needed on average for drilling to be profitable across the fields in which they are active (in alternate quarters they are asked what prices are needed for a substantial increase in drilling to occur). The average oil price needed was $57 per barrel, with a range of $40 to $80 (Chart 2). This profitable price average for oil was the highest level reported since Q3 2015. The average natural gas price needed was $3.88 per million Btu, with responses ranging from $2.00 to $7.50.
Chart 2. Special Question - What price is currently needed for drilling to be profitable for oil and natural gas, and what do you expect the WTI and Henry Hub prices to be in six months, one year, two years, and five years?
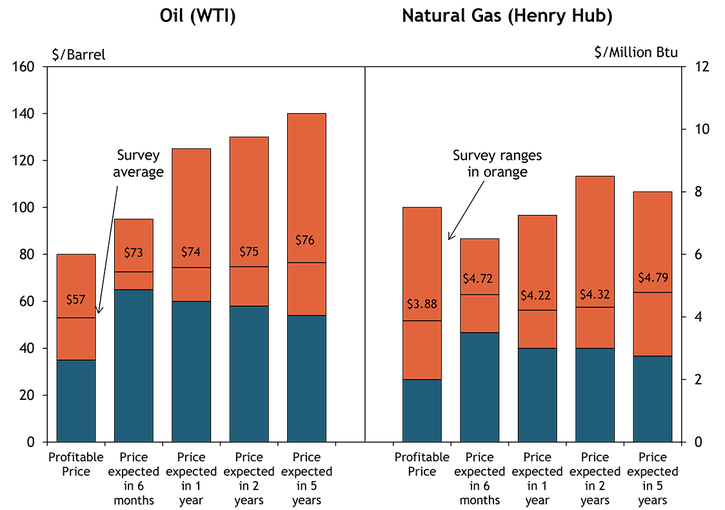
Firms were again asked what they expected oil and natural gas prices to be in six months, one year, two years, and five years. Oil price expectations were slightly lower than a quarter ago, while natural gas price expectations rose to the highest level recorded since the survey began this question in 2017. The average expected WTI prices were $73, $74, $75, and $76 per barrel, respectively. The average expected Henry Hub natural gas prices were $4.72, $4.22, $4.31, and $4.79 per million Btu, respectively.
Firms were also asked about the impact of COVID-19 infections over the past quarter, and over half of firms indicated minor delays or disruptions. 44% of firms reported difficulties hiring workers over the past quarter, while 26% of firms did not have any job openings, and 31% of contacts reported they were able to hire without difficulty.
Chart 3. Does your firm expect U.S. oil production to return to pre-pandemic levels?
Skip to data visualization table| Answer | Percent |
|---|---|
| Yes | 40.54054 |
| No | 59.45946 |
Finally, firms were asked their expectations for U.S. oil production (Chart 3). Around 60% of firms did not expect U.S. oil production to return to pre-pandemic levels, while 40% responded affirmatively that national oil production would rebound. Of those who responded yes, only 7% of contacts anticipated U.S. oil production would return to pre-pandemic levels by the end of 2021 (Chart 4). Of those who expected U.S. oil production to rebound, 47% of contacts expected it to return to pre-pandemic levels in 2022, 13% expected 2023, and a third of firms who expected production to rebound said it would occur beyond 2023.
Chart 4. Special Question - If yes, when?
Skip to data visualization table| Answer | Percent |
|---|---|
| Second half of 2021 | 6.666667 |
| 2022 | 46.66667 |
| 2023 | 13.33333 |
| Beyond 2023 | 33.33333 |


Selected Energy Comments
“Drilling costs are increasing significantly - on the order of 25% over the past six months. This is driving the breakeven needed for a drilling program higher.”
“The near-term supply and demand imbalance is pushing prices higher, particularly as the global consumption of oil rebounds. Additionally, U.S. producers are showing restraint allowing OPEC to throttle supply with a likely higher oil price than the long-term marginal barrel.”
“Short-term regulatory factors will drive pricing higher in the near-term leading to consumer pushback and ultimately increased drilling for oil and gas.”
“Associated gas will increase as the US shale drilling ramps up in future years. European demand will be further satisfied from Russian supply reducing the U.S. market share.”
“Worldwide demand for natural gas is extraordinarily strong.”
“Occasional positive [COVID] test will impact a crew or work site requiring confinement.”
“There has been a slowdown of permitting from the surface management agencies. Supply chain has also slowed down… parts not available.”
“Workers demanding work from home policy.”
“It takes a long time to ramp up production... at least two years lead time. Federal leases cannot be developed because of proposed regulation on federal fracturing ban.”
“Secondary production units have restarted as pricing improves.”
“Higher prices will open up existing wells shut in last year.”
“Independent producers have less access to credit than pre-pandemic levels (i.e. more difficult to expand), along with new found financial discipline that investors are demanding.”
Additional Resources
The views expressed are those of the authors and do not necessarily reflect the positions of the Federal Reserve Bank of Kansas City or the Federal Reserve System.
Author