Tenth District energy activity was flat in the first quarter of 2019, as indicated by firms contacted between March 18th and March 29th, 2019 (Tables 1 & 2). The drilling and business activity index increased from -13 to 0, indicating unchanged activity in Q1, following a decline in Q4 2018 (Chart 1). Indexes for total revenues and delivery time rose, and profits moved back into positive territory. However, the employment and wages and benefits indexes dipped further, and the index for access to credit remained negative.
Chart 1.
Drilling/Business Activity Index vs. a Quarter Ago
Skip to data visualization table| Date | Drilling/Business Activity |
|---|---|
| 2016Q1 | -72 |
| 2016Q2 | 0 |
| 2016Q3 | 26 |
| 2016Q4 | 64 |
| 2017Q1 | 55 |
| 2017Q2 | 43 |
| 2017Q3 | 7 |
| 2017Q4 | 13 |
| 2018Q1 | 37 |
| 2018Q2 | 26 |
| 2018Q3 | 45 |
| 2018Q4 | -13 |
| 2019Q1 | 0 |
Most year-over-year indexes decreased moderately. The year-over-year drilling and business activity index was flat, while indexes for revenues, capital expenditures, and profits dropped. Year-over-year employment, employee hours, wages and benefits, and access to credit indexes also dipped slightly.
Expectation indexes improved markedly, with the future drilling and business activity index jumping from -19 to 17, although this level of expectations was still lower than in 2017 and early 2018. The future revenues, capital expenditures, and profits indexes rebounded substantially as well, with positive readings. On the other hand, the future employment and access to credit indexes edged lower, and the expected wages and benefits index dipped to the lowest level since Q2 2017. The oil price expectations index increased modestly, from 29 to 34, and the natural gas price expectations index recovered substantially, increasing from -33 to 3.
Summary of Special Questions
This quarter firms were asked what oil and natural gas prices were needed for drilling to be profitable on average across the fields in which they are active (in alternate quarters they are asked what price they need for a substantial increase in drilling). The average oil price needed was $52 per barrel, with a range of $30 to $85 (Chart 2). This average was down slightly from $55 in the third quarter of 2018, but matched the price reported in the first quarter of 2018. The average natural gas price needed was $3.02 per million Btu, with responses ranging from $1.50 to $5.00.
Chart 2. Special Question - What price is currently needed for drilling to be profitable for oil and natural gas, and what do you expect the WTI and Henry Hub prices to be in six months, one year, two years, and five years?
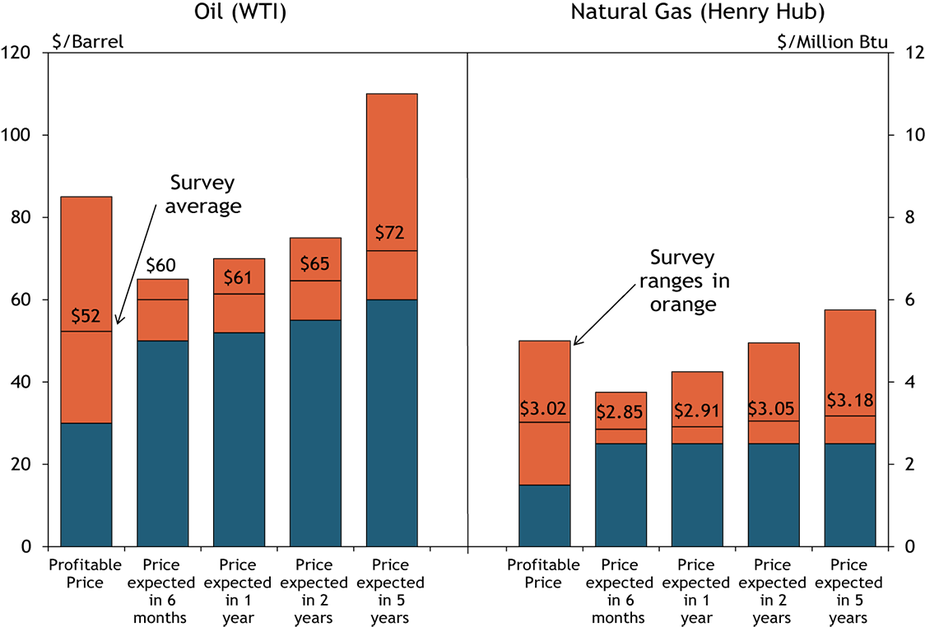
Source: Federal Reserve Bank of Kansas City
Firms were again asked what they expected oil and natural gas prices to be in six months, one year, two years, and five years. Expected oil prices increased since the last quarter, and were above the average price needed to be profitable. The average expected WTI prices were $60, $61, $65, and $72 per barrel, respectively. However, natural gas price expectations decreased. The average expected Henry Hub natural gas prices were $2.85, $2.91, $3.05, and $3.18 per million Btu, respectively.
Firms were also asked about their expectations for access to pipeline capacity in the next 6 to 12 months (Chart 3). More than 62 percent of energy contacts expect pipeline capacity to increase either significantly or slightly in the next year. Less than 12 percent of firms expect pipeline capacity to decrease.
Finally, respondents were asked about drilled but uncompleted (DUC) wells. Around 20 percent of firms indicated their number of DUC wells had increased compared to a year ago, while only around 8 percent expect their number of DUC wells to increase in the next 6 to 12 months (Chart 4).
Chart 3.
Special Question - How does your firm anticipate access to pipeline capacity will change in the next 6 to 12 months?
Skip to data visualization table| Change | Percent |
|---|---|
| Improve significantly | 19.23077 |
| Improve slightly | 42.30769 |
| No change | 26.92308 |
| Decrease slightly | 11.53846 |
| Decrease significantly | 0 |
Chart 4.
Special Question - Drilled but uncompleted wells
Skip to data visualization table| Change | How has your firm number of drilled but uncompleted wells changed compared to a year ago? | How do you expect your firm number of drilled but uncompleted wells to change in the next 6 to 12 months? |
|---|---|---|
| Increase significantly | 4 | 0 |
| Increase slightly | 16 | 8.333333 |
| No change | 80 | 91.66667 |
| Decrease slightly | 0 | 0 |
| Decrease significantly | 0 | 0 |
Table 1 - Summary of Tenth District Energy Conditions, Quarter 1, 2019

Source: Federal Reserve Bank of Kansas City
Table 2 - Historical Energy Survey Indexes

Source: Federal Reserve Bank of Kansas City
Selected Comments
“We are focusing on what we control, shoring up and improving our equipment, hoping that translates towards better efficiency, and doing so from cash flow and without taking on debt. Regardless of energy prices over the next 6 months, we want to reduce debt and be better positioned to ride out another downturn in pricing should that occur.”
“Commodity prices are the key determinant in any activity (capital expenditure changes). Most likely no change if prices are higher, and significantly lower prices would create a reduction in activity.”
“The market seems to have found a healthy supply and demand balance. That balance is being driven by oil supply being reduced from OPEC and demand remaining stable in spite of economic growth concerns.”
“We expect U.S. shale output will be limited by capital available. OPEC will continue to support pricing. Demand will continue to grow, albeit at a slower rate than before.”
“Completions activity has slowed and oil production has plateaued. The slowing production will be offset by slowing global demand caused by slower economic growth.”
“There is little lag between increased commodity prices and the ability to ramp up oil production, leading to more production and lower prices. It seems the market is able to reach supply-demand equilibrium (barring one-off geo-political events) much more quickly. Drilling and completion technology has led, again, to rapid production. Companies can simply move more quickly on shale plays with greater success.”
“Ample supply of gas will constrain the increase in gas prices over the next few years. Although export demand has grown (and will continue), there seems to be ample supply in the U.S. to cover this increase in demand.”
“More gas will be available to the market when pipelines are accessible from the Permian Basin.”
“We anticipate access to pipeline capacity will improve significantly in the next 6 to 12 months. Regional pipelines (Permian and Anadarko Basins) will come online. This will move the bottleneck downstream to the Gulf Coast.”
Additional Resources
The views expressed are those of the authors and do not necessarily reflect the positions of the Federal Reserve Bank of Kansas City or the Federal Reserve System.
Author