Center for Agriculture and the Economy
Leveraging expertise from the Kansas City Fed, the Center provides timely analysis of industry developments and conducts ongoing research on the agricultural economy.
Drought Intensity Adds Further Uncertainty to Cattle Herd Rebuilding
July 13, 2026
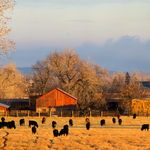
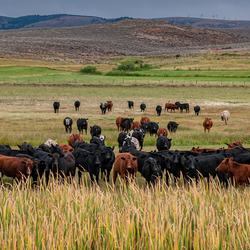
Intense drought has the potential to limit the rebuilding of cattle herds in regions with concentrated production, driving up beef prices. Beef inflation in the U.S. has been above historical norms, increasing by 17% since the beginning of 2025, amid strong consumer demand and low inventories of cattle. Further declines in inventories may exacerbate beef and food inflation and, historically, intense droughts in cattle-producing regions have led to herd liquidation. Drought often leads to degraded pastures and reduced forage quality, increasing operational costs by forcing ranchers to supplement their animals' diets with more expensive feed. If drought in cattle-producing regions intensifies, uncertainty about the balance of costs and expected revenue may also grow, increasing the risk of further declines in cattle inventories and higher beef prices.
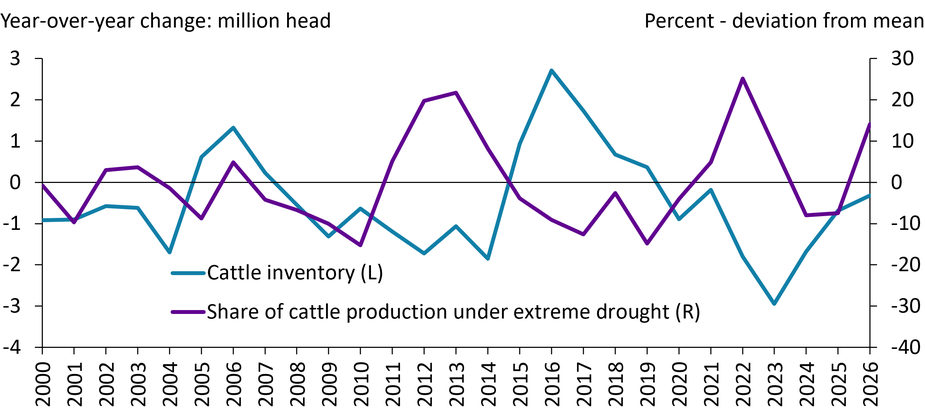
Cattle Inventories and Cattle Production Under Extreme Drought
Sources: USDA, UNL Drought Monitor, author’s calculations.
Find additional Insights on Agricultural and Rural Economies.
Research and Information
Agricultural Finance
Research and articles tracking trends in agricultural finance.
Insights on Ag and Rural Economies
Concise analysis on agricultural and rural economic trends.

Agricultural Data and Indicators
Data on economic and financial conditions in agriculture.
Agriculture Research Hub
All of the Kansas City Fed's research and resources on agriculture and related topics.
System Resources
Links to research and resources on agriculture and rural topics from throughout the Federal Reserve System.
Latest Research and Updates

-
New Farm Loan Originations Ease Slightly | -
Farm Loan Growth Remains Strong as Lending Shifts at Some Large Banks | -
How Will Drought and Groundwater Depletion Affect Irrigated Farmland Values in the Tenth District? | -
Continued Resilience in Farmland Values | -
Resilience, Not Crisis, in the U.S. Agricultural Economy | -
Deterioration in Farm Financial Conditions Remains Gradual |
-
New Farm Loan Originations Ease Slightly | -
Farm Loan Growth Remains Strong as Lending Shifts at Some Large Banks | -
Continued Resilience in Farmland Values | -
Sharp Growth in Tenth District Ranchland Values | -
Deterioration in Farm Financial Conditions Remains Gradual | -
Growth in Farm Lending Activity Persists |
The Kansas City Fed's Continuing Commitment to Agriculture
Through regular surveys, analysis and connections across the industry, the Kansas City Fed has had a longstanding focus on U.S. and global agriculture. Leveraging this expertise, the Center for Agriculture and the Economy serves as a resource within the Federal Reserve System by providing timely analysis of industry developments and conducting ongoing research on the agricultural economy. The Kansas City Fed is committed to understanding developments in the agricultural economy and gathering perspectives from rural America in order to include them in discussions on the national economy.
The Kansas City Fed's Ag Connection
Agriculture is central to the Kansas City Fed’s 10th District’s economy, from farm production and food manufacturing to agricultural banking and finance. Through its regular surveys, analysis and connections across the industry, the Kansas City Fed has had a longstanding focus on the U.S. and global agricultural economy. At the same time, connecting with stakeholders and ag industry professionals through events, round tables and conversations is critical to the Bank’s work.