Since the COVID-19 pandemic, changes in occupied office space in metropolitan downtowns have varied widely across the United States. This variation in the change in occupied office space across downtowns could be due to variation in the composition of employment or the desirability of working in specific downtowns. Some occupations are better suited to remote work than others, and some industries have embraced remote work more enthusiastically than others. In addition, some downtowns may be less desirable places to work due to a wide range of factors, such as the availability of public transit, parking, walkable amenities, public safety, or the quality of existing office buildings.
Using detailed data on leased office space, Jordan Rappaport documents that changes in occupied office space since the pandemic have varied widely across both downtowns and neighborhoods within the same downtown. Using detailed data on the composition of employment, he finds that variations in occupation and industry can account for only a modest share of the variation in the change in occupied office space across and within downtowns. Instead, most of the variation is likely attributable to other characteristics that make some downtowns more desirable places to work than others.
Article Citation
Rappaport, Jordan. 2025. "Accounting for Changes in Downtown Office Occupancy Since the Pandemic." Federal Reserve Bank of Kansas City, Economic Review, vol. 110, no. 3. Available at External Linkhttps://doi.org/10.18651/ER/v110n3Rappaport
Download Materials
Introduction
Many companies adopted fully remote or hybrid working arrangements during the COVID-19 pandemic, allowing their employees to work either full-time or part-time from home. Both fully remote and hybrid work have enabled companies to cut back on their office space. The associated declines in occupied office space have been especially sharp in some metropolitan downtowns: From late 2019 to mid-2024, occupied office space plunged by 29 percent in downtown San Francisco and by more than 19 percent in the downtowns of Denver, Seattle, and Portland, Oregon. In contrast, occupied office space declined only modestly in many other metropolitan downtowns and even increased in a few.
This variation in the change in occupied office space across downtowns could be due to variation in the composition of employment or the desirability of working in specific downtowns. Some occupations are better suited to remote work than others, and some industries have embraced remote work more enthusiastically than others; metropolitan downtowns with a higher share of these occupations may be more likely to experience a decline in occupied office space. In addition, some downtowns may be less desirable places to work due to a wide range of factors, such as the availability of public transit, parking, walkable amenities, public safety, or the quality of existing office buildings; downtowns whose desirability has decreased since the pandemic are similarly likely to experience a decline in occupied office space.
Using detailed data on leased office space, I document that changes in occupied office space since the pandemic have varied widely across both downtowns and neighborhoods within the same downtown. Using detailed data on the composition of employment, I find that variations in occupation and industry can account for only a modest share of the variation in the change in occupied office space across and within downtowns—likely no more than 18 percent and possibly much less. Instead, most of the variation is likely attributable to other characteristics that make some downtowns more desirable places to work than others, such as transit, parking, and walkable amenities.
Section I describes the wide variation in the change in occupied office space since the pandemic across and within metropolitan downtowns. Section II reports statistical correlations between the change in occupied office space and the share of office employment in various occupation and industry categories.
I. Changes in Downtown Occupancy Since the Pandemic
The COVID-19 pandemic changed work arrangements for millions of workers and considerably depressed office attendance, a key determinant of demand for office space. The blue line in Chart 1 shows that the average weekly office attendance for 10 large metropolitan areas, as measured by the total number of office building badge swipes, declined dramatically during the pandemic and has since plateaued at about 50 percent of its pre-pandemic level._ However, this average masks wide variation across metropolitan areas. In Austin (purple line), office attendance plateaued in 2024 at about 60 percent of its pre-pandemic level, while in San Francisco (green line), attendance plateaued at about 40 percent of its pre-pandemic level.
Chart 1: Average Weekly Office Attendance, 2020–25
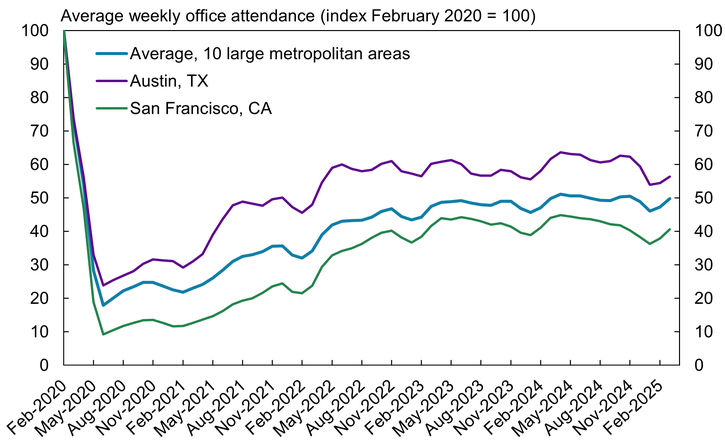
Note: Data are three-month moving averages and extend through March 2025.
Source: Kastle Systems (Haver Analytics).
Estimates based on visits to the downtowns of a larger set of metropolitan areas suggest an even wider dispersion of changes in activity across downtowns. For example, worker and nonworker visits to the downtowns of metropolitan and micropolitan areas in July 2022 ranged from 40 to 100 percent of visits in January 2020 (Monte, Porcher, and Rossi-Hansberg 2023). Another estimate of worker and nonworker visits suggests visits to downtowns in mid-2022 had rebounded to more than 115 percent in Salt Lake City, Bakersfield, Fresno, and El Paso relative to their level just before the pandemic (Chapple and others 2023).
Office occupancy—the amount of rentable office space that is occupied—has so far declined by less than attendance. The average decline in occupied space across 55 medium and large metropolitan office markets defined by CBRE Econometric Advisors was only 3 percent. Although occupied space declined by slightly more in the downtowns of those office markets, the average decline was still only 5 percent._
The modest average decline in occupied space masks huge variation across metropolitan downtowns. Chart 2 plots the change in occupied office space from 2019:Q4 to 2024:Q3 for 55 medium and large downtown office markets by the population of their metropolitan area in 2020. San Francisco experienced the largest decline in downtown office occupancy at 29 percent, and Denver, Seattle, and Portland, Oregon, each experienced a decline in downtown office occupancy of more than 19 percent. In sharp contrast, downtown office occupancy rose by 16 percent in Nashville and by more than 6 percent in Memphis, Tampa, and Fort Worth.
Chart 2: Change in Downtown Occupied Office Space by Metropolitan Size
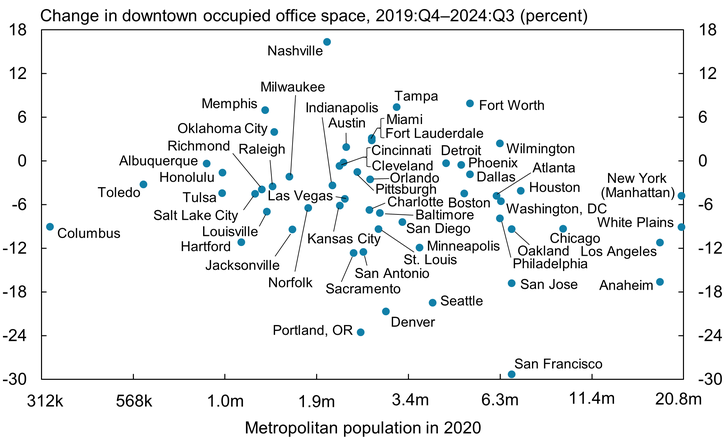
Notes: CBRE Econometric Advisors divides some metropolitan Core-Based Statistical Areas (CBSAs) into multiple metropolitan office markets, which it then subdivides into downtown and suburban portions. The vertical axis shows the percent change in occupied downtown space for these downtown markets defined by CBRE. The horizontal axis shows the population of the metropolitan areas in which they are located. In most cases, these metropolitan areas correspond to CBSAs. I combine CBSAs for four pairs that workers frequently commute between: Raleigh and Durham, Los Angeles and Riverside-San Bernardino, San Francisco and San Jose, and New York and Trenton-Princeton (Rappaport and Humann 2025). Metropolitan population is displayed on a logarithmic scale.
Sources: CBRE Econometric Advisors and author’s calculations.
One possible explanation for the wide variation is metropolitan size, as traffic congestion, long commutes, and limited parking can make working in the downtowns of larger metro areas more onerous for employees (Rappaport 2022). A related possibility is that some metropolitan areas have seen a greater shift from downtown to suburban offices than others, because of metro size or some other factor. Indeed, metro size shows a slight negative correlation with the change in downtown occupied office space.
However, neither metropolitan size nor associated shifts from downtown to suburban offices appears to account for much of the observed pattern of changes in occupied space. The wide vertical dispersion in Chart 2 shows that size accounts for only a modest share of the variation in occupancy._ For example, the booming Nashville downtown office market and the plunging Portland downtown office market belong to metropolitan areas of nearly the same size. Similarly, the downtown office markets of Oakland, San Jose, and San Francisco experienced widely different changes in occupied space despite belonging to the same metropolitan area.
The variation in the change in downtown occupied office space also does not appear to reflect varied shifts from downtown to suburban locations. Chart 3 plots the change in downtown occupied office space against the change in suburban occupied office space. The dashed diagonal line marks where the changes are equal: Dots above this line indicate metropolitan areas where downtown office occupancy either declined by less or increased by more than suburban occupancy, while dots below the line indicate metropolitan areas where downtown occupancy declined by more or increased by less. In two-thirds of metropolitan markets, downtown office occupancy either declined by more or increased by less than suburban occupancy.
Chart 3: Change in Occupied Office Space: Downtowns Versus Suburbs
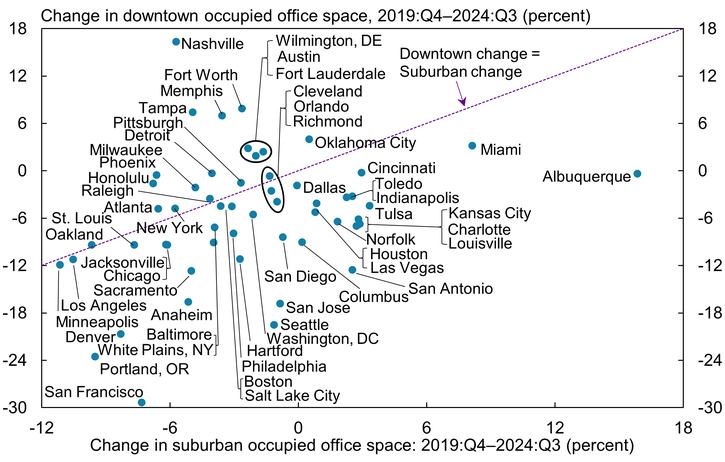
Sources: CBRE Econometric Advisors and author’s calculations.
The downtown and suburban changes have a slight positive correlation: Metropolitan office markets that experienced larger declines in occupied downtown space tended to experience larger declines in occupied suburban space. However, as in Chart 2, the wide vertical dispersion illustrates that the variation in the change in suburban occupancy accounts for very little of the variation in downtown occupancy._ For example, the metropolitan market with the most positive change in downtown office occupancy, Nashville, and the market with the most negative change in downtown occupancy, San Francisco, experienced similar declines in suburban office occupancy.
The weak relationship between changes in downtown and suburban occupied office space suggests that shared metropolitan characteristics, such as metropolitan traffic congestion, metropolitan office rents, and state-level taxes and regulations, are relatively unimportant in driving the decline in downtown office occupancy since the onset of the pandemic. Additionally, the lack of a negative relationship suggests that the decline in downtown occupancy does not reflect a shift toward suburban locations within the same metropolitan area.
Another possible explanation for the wide variation of the change in occupied office space could be longstanding trends that predate the pandemic rather than anything related to the adoption of fully remote and hybrid work. However, this is not the case. Chart 4 plots the change from 2019:Q4 to 2024:Q3 against the change from 2015:Q4 to 2019:Q4. The wide scatter suggests that variation during the earlier period cannot account for any of the variation in the latter period._ The lack of correlation also establishes that the change in downtown occupied office space since the pandemic is not a proportional reversal of a pre-pandemic trend: Downtowns that experienced larger declines since the pandemic did not tend to experience larger increases prior to the pandemic.
Chart 4: Changes in Downtown Occupied Office Space, Pre- and Post-Pandemic
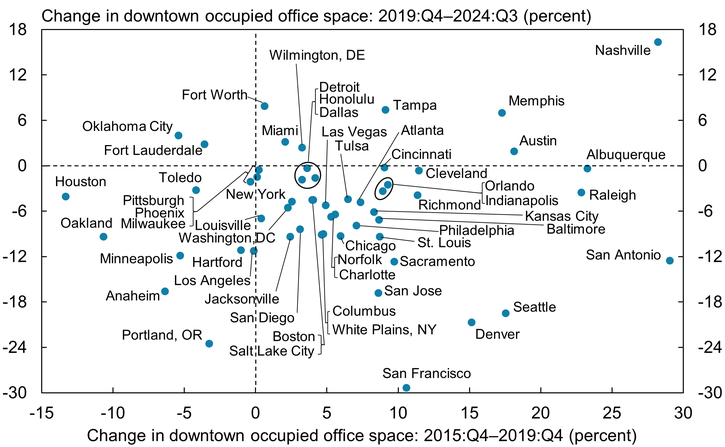
Sources: CBRE Econometric Advisors and author’s calculations.
In a broader sense, however, the widespread declines in downtown occupied office space since the pandemic do represent a reversal from widespread increases during the years just prior to the pandemic: Most downtowns experienced strong increases in occupied office space during the years just prior to the pandemic and most experienced contractions since the pandemic. The vertical dashed line divides downtowns where occupancy increased during the pre-pandemic period from those where it decreased. In 44 of the 55 downtowns, occupied space increased from 2015:Q4 to 2019:Q4; only five downtowns experienced a decline of more than 5 percent (Houston, Oakland, Anaheim, Oklahoma City, and Minneapolis). The horizontal dashed line divides downtowns where occupancy increased from 2019:Q4 to 2024:Q3 from those where it decreased. In 46 of the 55 downtowns, occupied space declined in this later period; 26 of these downtowns experienced a decline of more than 5 percent.
The wide variation in the change in occupied office space across downtown markets similarly characterizes the change in occupied office space across neighborhoods within downtowns, suggesting neighborhood characteristics may be important drivers of the change. CBRE divides many metropolitan downtowns into multiple submarkets. These and some adjacent submarkets that I judge belong to broadly construed downtowns allow me to analyze characteristics correlated with the change in occupied office space across 167 downtown neighborhoods._
Chart 5 illustrates the wide dispersion within some selected metropolitan downtowns. For example, the five blue circular markers correspond to neighborhoods in the broadly construed downtown of San Francisco. Three of these neighborhoods experienced especially dramatic declines in occupied office space: 33 percent in the South of Market (SoMa) West/Yerba Buena neighborhood and 28 percent in the South of Market (SoMa) and Financial District neighborhoods. In partial contrast, occupied office space declined by 9 percent in Union Square; in sharp contrast, occupied office space increased by 6 percent in Mission Bay/Potrero Hill. Other metros show similarly wide variation. In Seattle (blue triangles), changes in occupancy ranged from a 30 percent decline to a 5 percent increase; in Denver (purple squares), changes ranged from a 23 percent decline to a 20 percent increase.
Chart 5: Change in Occupied Office Space Across Downtown Neighborhoods
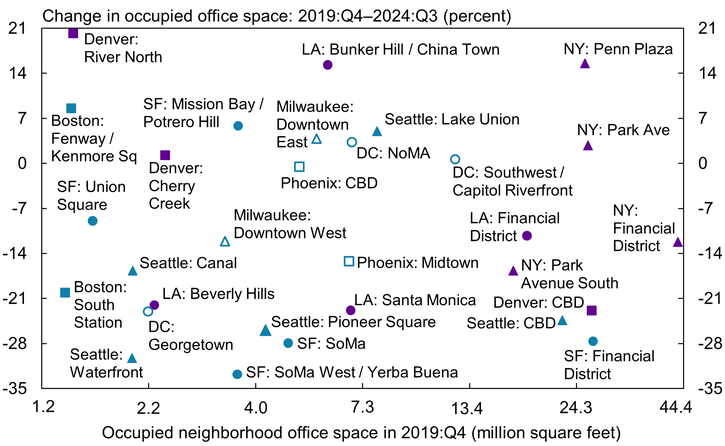
Notes: “CBD” is an acronym for a central business district. Office space on the x-axis is displayed on a logarithmic scale.
Sources: CBRE Econometric Advisors and author’s calculations.
This wide dispersion across downtown neighborhoods suggests that shared characteristics of entire downtowns, like those of entire metropolitan areas, are not the main drivers of changes in downtown occupied office space. Instead, characteristics that vary across neighborhoods, such as the composition of employment, amenities, and public safety, are likely to account for most of the differences.
II. The Composition of Downtown Employment
The composition of employment could be an especially important driver of the varied changes in downtown occupied office space, as the prevalence of remote work is likely to vary substantially across occupations and industries. The day-to-day tasks of some office jobs are easier to perform remotely than others. For example, estimates suggest that almost all computer/math jobs can be done remotely, as can most business/financial specialist jobs; in contrast, estimates suggest almost no jobs in healthcare can done remotely (Dingel and Nieman 2020). Complementing this difference, industries in which remote-friendly occupations account for a larger share of employment may have been more amenable to a shift to remote working for all employees, regardless of occupation._
Table 1 reports the separate statistical relationships between the change in occupied office space across the 167 downtown neighborhoods in my sample and the share of employment in each of 11 occupation categories for which a considerable share of onsite work is likely to occur in office space. (For this purpose, I calculate office employment as the sum of employment in the 11 occupations.)_ Unsurprisingly, changes in occupied space show the strongest relationship with the share of office employment in computer and mathematical occupations. The estimated coefficient implies that a 1 percentage point increase in the share of office employment in computer/math occupations is associated with 0.7 percentage point greater decline in occupied office space. Correspondingly, a computer/math occupation share that is higher by one standard deviation—3.8 percentage points—is associated with a change in occupied office space that is 2.7 percentage points lower._ The R2 value of the relationship implies that the variation in the computer/math occupation share across the 167 downtown submarkets can mechanically account for 7.0 percent of the variation in the change in occupied space, the highest amount for any single characteristic in Table 1.
Table 1: Change in Occupied Space and Composition of Office Employment by Occupation
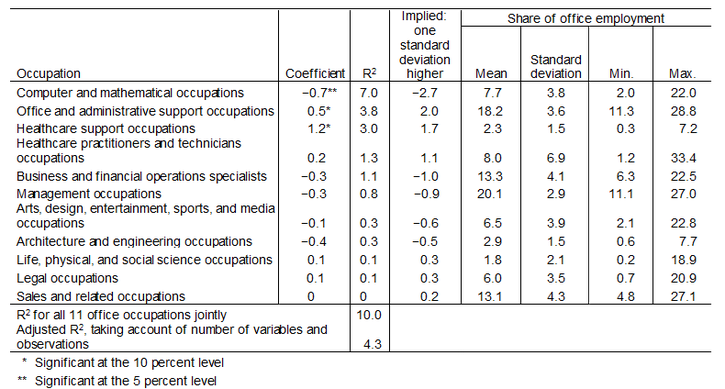
Notes: The first two columns report results from univariate regressions of the change in submarkets’ occupied office space from 2019:Q4 to 2024:Q3 on an occupation category’s average share of office employment from 2012 to 2016. The R2 column reports the percentage of the variation of the change in occupied space across the 167 downtown neighborhoods that is mechanically accounted for by the variation in an occupation category’s share. The third column reports the percentage point change in occupied office space implied by the coefficient for a one standard deviation increase in the occupation category’s share of office employment. The R-squared value near the bottom of the table is for a regression of the change in occupied space on 10 of the 11 occupation categories, which implicitly controls for the excluded one because the category shares sum to 100. The adjusted R-squared value discounts the share of the variation accounted for by this regression’s right-hand-side variables based on the large number of such variables relative to the number of observations.
Importantly, the negative correlation between computer/math employment and the change in occupied office space is not a causal relationship. Although the correlation may indeed reflect businesses allowing employees in these occupations to work remotely because of the feasibility of doing so, it may also reflect a causal relationship with other neighborhood characteristics that are correlated with computer/math employment. For example, many computer programmers work at small start-up firms, which may have been able to more flexibly shift to full-time remote work. The negative correlation may also reflect a noncausal relationship with neighborhood characteristics. For example, businesses may have previously chosen to locate math/computer employment in certain types of downtown neighborhoods that later became undesirable locations to work. In addition, the magnitude of the coefficient may be misleadingly large, reflecting that downtown neighborhoods with a high share of computer/math employment may also have a higher share of employment in other remote-friendly occupations.
The estimated coefficients statistically differ from zero for only two other occupation categories: healthcare support and office and administrative support. Higher shares of office employment in healthcare support occupations and in office and administrative support occupations are each associated with more positive (and less negative) changes in occupied office space. Although this finding could suggest these jobs are unable to be performed remotely, it could also suggest that managers of workers in these occupations are simply less willing to allow employees to work remotely.
The last two rows of Table 1 report results from regressing the change in occupied office space on the share of employment in 10 of the 11 occupational categories. Doing so implicitly controls for all 11 occupations, reflecting that their shares sum to 100. Altogether, the joint variation of the occupation shares across the 167 downtown neighborhoods can account for 10.0 percent of the variation in the change in their occupied office space. This likely overstates the importance of the occupational composition in determining the change in occupancy: With only 167 observations, any 10 right-hand-side variables, even if all values are random, can account for a nontrivial share of the variation of any left-hand-side variable. The adjusted R2 value shows that after controlling for this discrepancy, the occupation composition may explain as little as 4.3 percent of the variation in the change in occupied office space.
Table 2 reports analogous statistical relationships between the change in a downtown’s occupied office space and the share of its office employment in each of 11 industry categories._ Doing so partly captures the extent to which businesses in some industries may be more willing to let office employees work remotely, regardless of their specific occupation.
Table 2: Change in Occupied Space and Composition of Office Employment by Industry
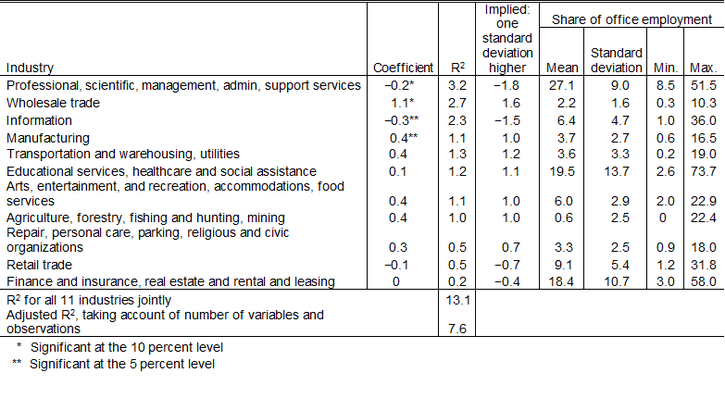
Notes: The first two columns report results from univariate regressions of the change in submarkets’ occupied office space from 2019:Q4 to 2024:Q3 on an industry’s average share of office employment from 2012 to 2016. The third column reports the percentage-point change in occupied office space implied by the coefficient for a one standard deviation increase in the industry’s share of office employment. The R-squared value, near the bottom of the table, is for a regression of the change in occupied space on 10 of the 11 occupation categories, which implicitly controls for the excluded one because the category shares sum to 100. The adjusted R-squared value discounts the share of the variation accounted for by this regression’s right-hand-side variables based on the large number of such variables relative to the number of observations.
Two of the industry categories—the information industry and the professional, scientific, management, administration, and support services industry—have a negative, statistically significant relationship with the change in occupied office space, implying that downtowns with higher shares of workers in these industries typically experienced larger percentage declines in occupied space. Variation in the professional, scientific, management, administration, and support services share of employment can account for 3.2 percent of the variation in the change in occupied office space across the 167 downtown neighborhoods. Variation in the information share of employment can account for 2.3 percent of the variation in the change in office occupancy.
Two other industry categories—wholesale trade and manufacturing—have a positive, statistically significant relationship with the change in occupied office space, implying downtowns with a greater share of employment in these industries typically experienced smaller declines in occupied office space. The variation in the share of office employment in wholesale trade industries can account for 2.7 percent of the variation in the change of occupied office space; the variation in the share of office employment in manufacturing industries can account for 1.1 percent of it. One possible interpretation of these positive relationships is that businesses in the wholesale trade and manufacturing industries may be requiring workers in office occupations to spend more time onsite to better align with workers in non-office occupations, whose tasks may be difficult to accomplish remotely.
The joint variation in the share of office employment in the 11 industry categories across the 167 downtown neighborhoods can account for 13.1 percent of the variation in the change in occupied office space. As with occupation, this figure may overstate the importance of the industry composition of employment in determining the change in occupancy. Adjusting for the large number of right-hand-side variables relative to the number of observations suggests that the industry composition may explain as little as 7.6 percent of the change in occupied office space.
To deepen the analysis, I next look at the relationship between the change in occupied office space and each of the 121 possible combinations of office occupation and industry. Doing so identifies industries that may be propping up or depressing the average remote share for the paired occupation, regardless of industry. Table 3 reports results for the 19 occupation-industry subcategories that each accounted for at least 1 percent of office employment in at least one submarket and for which the correlation with the change in occupied space is statistically significant.
Table 3: Change in Occupied Space and Composition of Office Employment by Occupation-Industry Subcategory
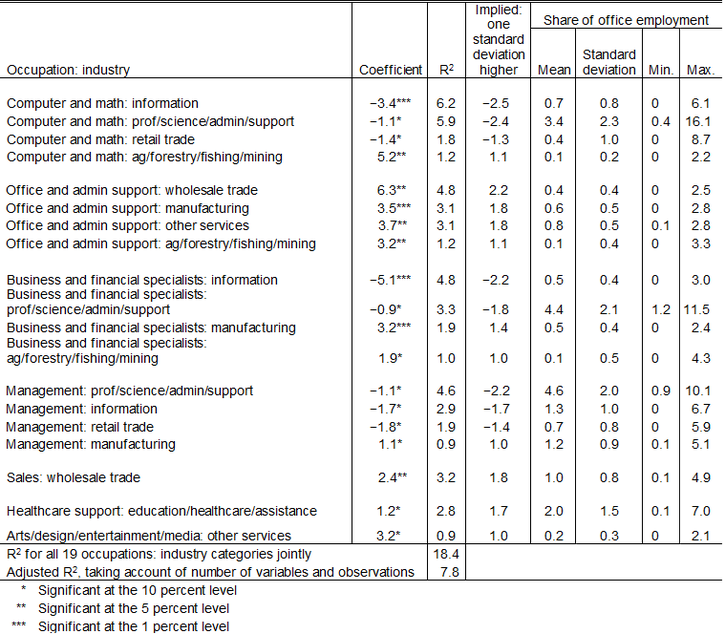
Notes: The first two columns report results from univariate regressions of the change in submarkets’ occupied office space from 2019:Q4 to 2024:Q3 on an occupation-industry pair’s average share of office employment from 2012 to 2016. The third column reports the percentage-point change in occupied office space implied by the coefficient for a one standard deviation increase in the occupation-industry pair’s share of office employment. The R-squared value near the bottom of the table is for a regression of the change in occupied space on all 19 occupation-industry pairs. The adjusted R-squared value discounts the share of the variation accounted for by this regression’s right-hand-side variables based on the large number of such variables relative to the number of observations.
The large number of statistically significant correlations suggests that the combination of occupation and industry, in addition to either on their own, is an important determinant of the likelihood of working remotely and hence of changes in occupied downtown office space. For example, as reported in Table 1, the change in downtown occupied office space is only weakly correlated with the share of neighborhood employment in management occupations. But as reported in Table 3, the change in downtown occupied office space is strongly negatively correlated with the share of neighborhood employment in management occupations in the professional/science/administration/support, information, and retail trade industries. More broadly, most of the negative correlations are for subcategories that include employment in three of the office occupation categories—computer and math, business and financial specialists, and management—and two of the industry categories—information and professional services. Most of the positive relationships are for subcategories that include the office and administrative support occupations category, the manufacturing industry category, or the agriculture/forestry/fishing/mining industry category.
The magnitude of the statistically significant coefficients for many of the occupation-industry subcategories considerably exceed those for the occupation and industry shares on their own. For example, each percentage point increase in the employment share in the subcategory that intersects computer and math occupations with the information industry is associated with a 3.4 percentage point lower change in occupied office space. Interpreted literally, this result might suggest that workers in this subcategory occupy more than three times as much office space as most workers in other subcategories. A more likely interpretation is that the large magnitudes capture positive correlations among occupation-industry subcategories for which remote working is more prevalent. For example, neighborhoods with a higher share of office employment in the subcategory of computer and math occupations in the information industry are likely to also have a high share of office employment in subcategory of business and financial specialists in the information industry (for which a percentage point higher share is associated with a 5.1 percentage point lower change in occupied office space). Consistent with this interpretation, the differences in the expected changes in occupied office space implied by one standard deviation differences in occupation-industry shares are similar to those reported in Tables 1 and 2, reflecting that the standard deviations of the occupation-industry shares are smaller.
The last row of Table 3 reports the results from regressing the change in occupied office space on the employment shares in each of the enumerated 19 occupation-industry pairs. The joint variation in these across the 167 downtown submarkets can account for 18.4 percent of the variation of the change in occupied office space. Adjusting for the large number of right-hand-side variables relative to the number of observations suggests that the occupation-industry composition of employment may explain as little as 7.8 percent of the change in occupied office space, approximately the same as the adjusted R2 value for industry composition alone.
Overall, these empirical results suggest that the occupation and industry composition of downtown office employment can only modestly account for the variation across and within metropolitan downtowns. At most, it may account for about 18 percent of the variation and likely explains somewhat less. Some of the remaining variation may reflect other differences in the composition of employment, such as the age and size of businesses. Much of the remaining variation likely reflects characteristics of specific downtown neighborhoods, including the desirability of working there.
The relationship between the desirability of working in downtown neighborhoods and changes in office occupancy depends both on the level of desirability prior to the pandemic and changes in desirability since its onset. For example, some neighborhoods that experienced large declines in occupancy may have been considered relatively undesirable prior to the pandemic, perhaps because of older office buildings, lack of parking or public transit, long commutes, or sparse nearby amenities such as restaurants and cafes. Workers with offices in these neighborhoods are likely to disproportionately value working remotely compared with similar workers with offices in more desirable submarkets. Employers in less desirable neighborhoods may be more willing to accommodate remote working to compete for employees or may choose to take advantage of declines in office rents since the pandemic to lease space in more desirable locations.
Other downtown neighborhoods that experienced large declines in occupancy may have been considered relatively desirable prior to the COVID-19 pandemic but less so presently. For example, several of the downtown neighborhoods in Chart 5 that subsequently experienced the largest declines were popular dining and shopping destinations prior to the pandemic, including Beverly Hills and Santa Monica in Los Angeles, South of Market and Yerba Buena in San Francisco, Pioneer Square and the Waterfront in Seattle, and Georgetown in Washington, DC. Some news sources report that these neighborhoods have experienced high levels of theft, homelessness, or open drug use in recent years. Deteriorations in public safety could serve as a negative feedback mechanism, in the sense that large declines in business activity during the initial phases of the pandemic may have created space for undesired activity that in turn has discouraged onsite attendance.
Conclusion
The COVID-19 pandemic caused many companies to adopt fully remote and hybrid working arrangements for office workers, which many have retained in part in recent years. This resulting decline in demand for office space has contributed to sharp declines in occupied space in some metropolitan downtowns but not in others. The day-to-day tasks of some office jobs can more feasibly be performed remotely than others, and businesses in some industries may be more willing to let office employees work remotely, suggesting that the occupation and industry composition of employment may account for the varied changes in occupied space. However, correlations between the composition of employment and the change in occupied space across and within metropolitan downtowns can account for only a small portion of the total variation. Factors determining the desirability of certain locations are likely to explain much of the remainder.
The undesirability of working in specific downtown neighborhoods may pose challenges to boosting office occupancy. Some businesses that previously occupied office space in neighborhoods that have become less desirable may move to other locations. Others may continue allowing their employees to spend a larger share of time working remotely. To the extent that declines in the desirability of working in specific neighborhoods is deterring rebounds in office occupancy, public policy may be able to play a role in preventing permanent declines.
More generally, hybrid working does not necessarily put downtowns at a disadvantage to suburbs in attracting office tenants. Indeed, coming into the office less frequently ameliorates the burden of commuting in from suburbs, and the flexibility of hybrid working may make it easier for couples to pursue dual careers, increasing the importance of having an office in a central location. However, for considerations such as these to play a significant role, downtown neighborhoods must be sufficiently desirable as a place to work.
Download Materials
Endnotes
-
1 Kastle Systems, a company that manages security and building access, calculates indexes of office occupancy based on daily badge swipes at buildings it manages throughout the United States. It reports these indexes for 10 metropolitan areas: Austin, Chicago, Dallas, Houston, Los Angeles, New York, Philadelphia, San Francisco, San Jose, and Washington, DC.
-
2 I adjust formally occupied office space by subtracting occupied space that is available for rent (including sublease) and adding unoccupied space that has been rented but for which the tenant has not yet moved in. This adjustment equates occupied space with the total rentable stock of office space minus space that is available for rent. The 55 downtown office markets are those defined by CBRE that had at least 1 million occupied square feet of office space in 2019:Q4. In some cases, CBRE defines more than one metropolitan office market within the same metropolitan Core-Based Statistical Area.
-
3 A regression of the change in downtown occupied office space on the log of metropolitan population in 2019:Q4 yields an R-squared value of 0.058 and a coefficient of −2.3, which statistically differs from zero at the 10 percent level (p-value = 0.094). Monte, Porcher, Rossi-Hansberg (2023) similarly estimate a negative relationship between downtown attendance in mid-2022 and metropolitan population.
-
4 A regression of the change in downtown occupied office space on the change in suburban occupied office space yields an R-squared value of 0.083 and a coefficient of 0.48, which statistically differs from zero at the 1 percent level.
-
5 A regression of the change in downtown occupied office space from 2019:Q4 to 2024:Q3 on the change in downtown occupied office space from 2015:Q4 to 2019:Q4 yields a coefficient of 0.10, which does not statistically differ from 0 (the p-value is 0.45), and an R-squared value of 0.011.
-
6 CBRE Econometric Advisors divides its metropolitan office markets into several major markets, typically with one of these designated as “downtown.” It further divides many major markets into multiple submarkets. For example, it divides its downtown Minneapolis office market into one submarket corresponding to the Minneapolis central business district and one corresponding to the St. Paul central business district. I designate a number of additional submarkets not included in the CBRE downtown major market as belonging to a broadly construed notion of downtown areas. For example, CBRE divides its delineation of downtown San Francisco into two submarkets: the Financial District and the South Financial District. I designate an additional six CBRE submarkets in San Francisco as belonging to its downtown. Four of these directly adjoin the CBRE downtown submarkets: South of Market, South of Market West/Yerba Buena, Union Square, and North Waterfront/Jackson Square. The remaining two, Civic Center/Van Ness and Mission Bay/China Basin/Potrero Hill, are located about a mile away. My criteria in making these designations include being located near the CBRE-delineated downtown, the presence of dense office employment, and the absence of surface parking lots directly fronting business establishments (determined using Google Earth). I also designate as belonging to a downtown several additional submarkets that include “CBD” (for Central Business District) or “downtown” in their title. The CBRE downtown submarkets, together with the CBRE downtown markets that are not subdivided and the CBRE submarkets I designate as belonging to a downtown, constitute 178 downtown “neighborhoods.” I drop eight of these neighborhoods from the analysis because their occupied office space in 2019:Q4 was less than 1 million square feet. I drop an additional three neighborhoods with especially large increases in occupied office space from 2019:Q4 to 2024:Q3 to avoid skewing the analysis. Specifically, occupied office space in Chicago’s Fulton Market/Far West Loop submarket increased by 89 percent, occupied office space in Charlotte’s midtown submarket increased by 60 percent, and occupied office space in Dorchester/South Boston increased by 44 percent. Occupied office space in the neighborhood with the next largest increase, downtown Nashville, increased by just 16 percent. These adjustments leave 167 observations for the analysis. The change in office occupancy from 2019:Q4 to 2024:Q3 does not statistically differ between the 117 neighborhoods that belong to the CBRE downtown major markets and the 50 additional submarkets that I judge belong to broadly construed downtowns.
-
7 There are several reasons why businesses in industries with a large share of workers in remote-friendly occupations may be more amenable to letting employees in other occupations work remotely. One is a sense of fairness, mitigating possible resentment towards employees who are allowed to work remotely. Another is that the marginal value added by employees in other occupations working onsite rather than remotely may be diminished by employees in the remote-friendly occupations working remotely.
-
8 The Census Transportation Planning Package retabulates responses to the 2012–16 American Community Survey (ACS) based on the census tract in which respondents report working. I use ArcMap to match census tracts to the CBRE submarkets. I apportion the employment of census tracts that overlay multiple submarkets based on the shares of its land area in each. The ACS classifies workers into 24 occupational categories (for example, management occupations, computer and math occupations, and production occupations) and 14 industry categories (for example, retail trade, wholesale trade, and information). Among the occupation categories, I judge that 11 have a large share of jobs in offices, and so changes in these occupations’ demand for space will directly affect the change in total occupied office space. Among the industries, two—public administration and the armed forces—are likely to occupy office space that they own and so I exclude employment in them from the analysis. I also exclude office employment in the construction industry, as many of these jobs may be located near office construction sites. To calculate the denominator for measuring shares of office employment, I sum the employment in each of 121 occupation-industry subcategories (combinations of the 11 office occupations and 11 non-excluded industries). Equivalently, I calculate office employment as the sum of employment in the 11 office occupations less employment in these occupations that is in the public administration, armed forces, and construction industries.
-
9 Multiplying the coefficient by the standard deviation of the share of employment gives a better sense of the variation in occupied space office space implied by the correlation. For math/computer occupations, a share of neighborhood employment that is higher by one standard deviation—3.8 percentage points—is associated with a change in occupied office space that is 2.7 percentage points lower. For comparison, the coefficient on the share of employment in healthcare support occupations is larger in magnitude, but the implied magnitude of a one standard deviation increase is smaller in magnitude.
-
10 I construct the industry shares using only the occupations enumerated in Table 1. For example, office employment in the manufacturing industry is the sum of employment in the manufacturing industry in each of the 11 categories of office occupations. For this reason, the industry shares I use for analysis are not affected by the presence of workers in non-office occupations.
Article Citation
Rappaport, Jordan. 2025. "Accounting for Changes in Downtown Office Occupancy Since the Pandemic." Federal Reserve Bank of Kansas City, Economic Review, vol. 110, no. 3. Available at External Linkhttps://doi.org/10.18651/ER/v110n3Rappaport
Publication information: Vol. 110, no. 3
DOI: 10.18651/ER/v110n3Rappaport
References
Chapple, Karen, Hannah Moore, Michael Leong, Daniel Huang, Amir Forouhar, Laura Schmahmann, Joy Wang, and Jeff Allen. 2022. “The Death of Downtown? Pandemic Recovery Trajectories Across 62 North American Cities.” University of Toronto’s School of Cities and the University of California, Berkeley’s Institute of Governmental Studies, Research Brief, June, updated January 2023.
Couture, Victor, and Jessie Handbury. 2017. “Urban Revival in America, 2000 to 2010.” National Bureau of Economic Research, working paper no. 24084, June. Available at External Linkhttps://doi.org/10.3386/w24084
Dingel, Jonathan I., and Brent Nieman. 2020. “How Many Jobs Can Be Done at Home?” Journal of Public Economics, vol. 189. Available at External Linkhttps://doi.org/10.1016/j.jpubeco.2020.104235
Monte, Ferdinando, Charly Porcher, and Esteban Rossi-Hansberg. 2023. “Remote Work and City Structure.” National Bureau of Economic Research, working paper no. 31494, July. Available at External Linkhttps://doi.org/10.3386/w31494
Rappaport, Jordan. 2022. “Hybrid Working, Commuting Time, and the Coming Long-Term Boom in Home Construction.” Economic Review, vol. 107, no 4, pp. 5–39. Available at External Linkhttps://doi.org/10.18651/ER/v107n4Rappaport
Rappaport, Jordan, and McKenzie Humann. 2025. “A Better Delineation of U.S. Metropolitan Areas.” Federal Reserve Bank of Kansas City, Research Working Paper no. 25-01, April. Available at External Linkhttps://doi.org/10.18651/RWP2025-01
Smart Growth America. 2015. “Core Values: Why American Companies Are Moving Downtown.” Smart Growth America, June.
Stanek, David, Richard Voith, and Susan Wachter. 2024. “Reflections on Doom Loop or Boom Loop: Work from Home and the Challenges Facing America’s Big Cities.” Penn Institute for Urban Research, June 26. Available at External Linkhttps://doi.org/10.2139/ssrn.4877862
Jordan Rappaport is a senior economist at the Federal Reserve Bank of Kansas City. The views expressed are those of the author and do not necessarily reflect the positions of the Federal Reserve Bank of Kansas City or the Federal Reserve System.
Author
