Despite significant disruptions to the economy during the pandemic, household balance sheets remained surprisingly strong. Substantial government transfers and altered spending patterns led to excess savings peaking at $2.3 trillion in the third quarter of 2021 (Aladangady and others 2022). Although excess savings have since declined, updated estimates show that excess savings remained around $1.1 trillion through the end of 2022.
These excess savings could allow consumers to repay debt; however, average consumer debt has actually increased. Chart 1 shows that by the end of 2022, real average total consumer debt (blue line) was nearly 5 percent higher compared with pre-pandemic levels. The overall increase occurred due to an increase in the amount borrowed and an increase in the number of new loans in general. In fact, the new loan success rate—the share of new credit accounts opened divided by credit inquiries—increased from 45 percent in January 2020 to 52 percent in December 2022, indicating credit access increased over the past three years._
Chart 1: Real average total consumer debt increased in 2022
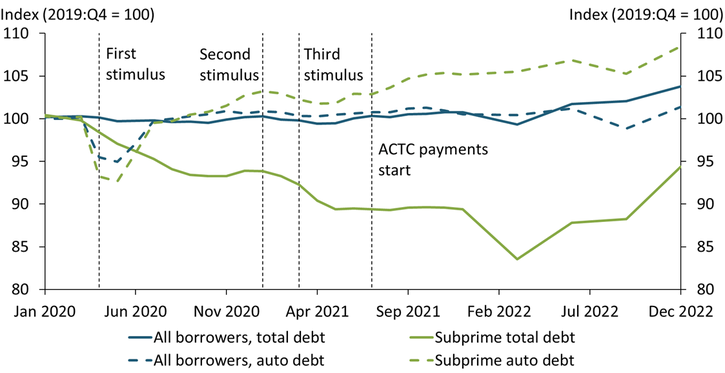
Notes: Subprime data are average tabulations of debt from consumers with an Equifax Risk Score below 620. ACTC payments are the Advance Child Tax Credit made available under the American Rescue Plan.
Source: Federal Reserve Bank of New York Consumer Credit Panel/Equifax.
Whether this rise in average consumer debt is concerning depends on both the types of loans being secured and borrowers’ relative risk profiles. A natural question is how much the rise in average total debt is being driven by subprime borrowers—those with an Equifax Risk Score below 620—or by debt in a particular category. The green line in Chart 1 shows that real consumer debt declined for subprime borrowers throughout the pandemic, reaching its lowest point in March 2022. Since then, average subprime debt has risen but remained below pre-pandemic levels as of December 2022. However, auto debt for subprime borrowers has risen relative to pre-pandemic levels. The dashed green line shows that subprime borrowers’ real average auto debt—which makes up 7 percent of all non-housing consumer debt in the United States—has steadily increased since mid-2020 and is now about 10 percent higher compared with pre-pandemic levels. In contrast to subprime borrowers, real average auto debt across all borrowers has remained flat over the same period (blue dashed line).
Although the fiscal transfers in the early stages of the pandemic helped subprime borrowers deleverage and reduce delinquency, subprime delinquency rates began rising even before federal payments ended. Chart 2 shows the share of auto debt newly transitioning into delinquency (with loan payments more than 30 days overdue) for all borrowers and subprime borrowers. While subprime transition rates (green line) initially followed a similar downward trend as all borrowers (blue line), transition rates for subprime borrowers began rising again in March 2021, about nine months earlier than for all borrowers. As of December 2022, transition rates into delinquency for subprime auto debt were about 10 percent higher compared with pre-pandemic levels.
Chart 2: Subprime transition rate into auto delinquency (30+ days) is above pre-pandemic levels
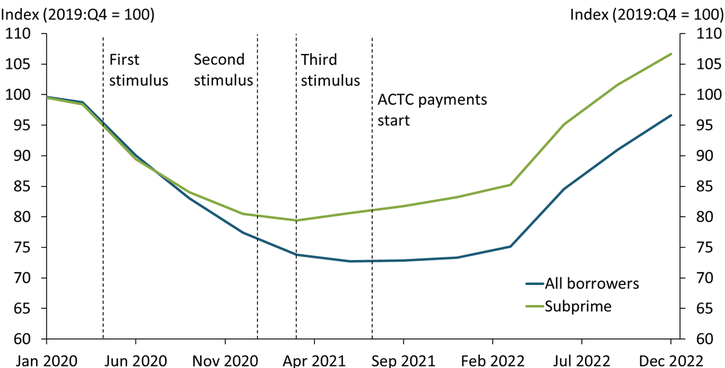
Note: Delinquency transition rates are the share of debt newly transitioning into delinquency (30+ days).
Source: Federal Reserve Bank of New York Consumer Credit Panel/Equifax.
Although delinquency rates have risen, they would likely be even higher without strong wage and salary growth. As of 2022:Q3, real wages and salaries grew 2.8 percent year-over-year. Chart 3 shows that wage and salary growth have historically had a strong negative relationship with auto delinquency—that is, as wage and salary growth decrease, delinquency transition rates tend to rise. The current tight labor market is supporting strong wage growth, likely making debt repayment capacity higher than normal. However, if the labor market were to cool quickly, including large layoffs and a decline in wage growth, the increase in auto debt over the past two years could lead delinquency rates to rise rapidly.
Chart 3: Higher wage growth is typically associated with lower delinquency transition rates
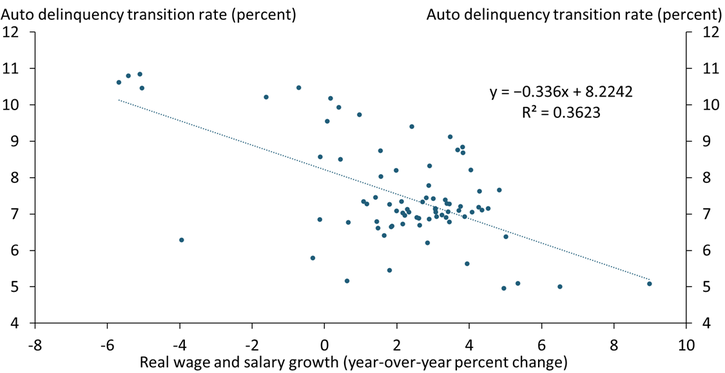
Note: The chart shows the relationship between real wage and salary growth and auto delinquency transition rates over the period 2003:Q1 to 2022:Q3.
Sources: Federal Reserve Bank of New York Consumer Credit Panel/Equifax and the U.S. Bureau of Economic Analysis (Haver Analytics).
The increase in delinquency for subprime auto debt has been relatively modest, but debt risks may lie in other areas. Indeed, mortgage and other loan forbearances passed in pandemic stimulus bills may have clouded where these risks truly lie, including by delaying their visibility in consumer credit report data. From March 2020 to May 2021, more than 70 million consumers with loans worth $2.3 trillion entered forbearance, missing $86 billion in payments (Cherry and others 2021). During that period, 6.3 million mortgages, 11 million auto loans, 68 million student loans, and 62 million revolving loans (such as credit cards) were in forbearance. Borrowers in forbearance in January 2022 were reported to have less financial capacity, on average, than borrowers in forbearance in March 2021 (Li and Ricks 2022). Less financial capacity is consistent with rising transitions to delinquency, especially for subprime borrowers of auto debt who were likely credit constrained to some extent prior to the pandemic.
Because some borrowers may still be eligible for forbearance through mid-2023, it may take more time for risks in the consumer debt market to fully emerge._ Subprime borrowers are likely to experience the economic stress of job loss and difficulty making debt payments ahead of other borrowers, thus serving as a leading indicator of what happens in the consumer debt market when the music of excess savings, forbearance, and high wage growth stops.
Endnotes
-
1 We measure credit access by the new loan success rate—specifically, the share of new accounts opened within the last 12 months divided by the number of inquiries within the last 12 months in the New York Fed Consumer Credit Panel.
-
2 See Consumer Financial Protection Bureau (2021) for details about COVID-related loan forbearance.
References
Aladangady, Aditya, David Cho, Laura Feiveson, and Eugenio Pinto. 2022. “External LinkExcess Savings during the COVID-19 Pandemic.” Board of Governors of the Federal Reserve System, FEDS Notes, October 21.
Cherry, Susan F., Erica Xuewei Jiang, Gregor Matvos, Tomasz Piskorski, and Amit Seru. 2021. “External LinkGovernment and Private Household Debt Relief during COVID-19.” Brookings Papers on Economic Activity, August.
Consumer Financial Protection Bureau. 2021. “Learn about Forbearance.”
Li, Greta, and Judith Ricks. 2022. “External LinkNew Data on the Characteristics of Mortgage Borrowers During the COVID-19 Pandemic.” Consumer Financial Protection Bureau Office of Research, Reports Series no. 22-2.
Jason P. Brown is a vice president and economist at the Federal Reserve Bank of Kansas City. Colton Tousey is an assistant economist at the bank. The views expressed are those of the authors and do not necessarily reflect the positions of the Federal Reserve Bank of Kansas City or the Federal Reserve System.
Authors

Jason P. Brown
Vice President and Economist