The U.S. labor share of income declined sharply from 2000 to 2010 but seems to have stabilized more recently, raising questions about the forces driving its trends. The labor share corresponds to the share of national income that is paid to workers in the form of labor compensation, which includes wage and salary compensation along with benefits. Until 2000, this share had been stable for over four decades. Chart 1 shows that the nonfarm labor share remained fairly stable between the late 1940s and the early 2000s, fluctuating around 63 percent._ This stability resulted from two coincidental changes affecting the labor share in opposite directions (Elsby, Hobijn, and Şahin 2013; Armenter 2015). First, the composition of U.S. industries dramatically shifted away from manufacturing toward services during this period. Because the manufacturing industry had a relatively high labor share, while the services industry had a lower labor share, this shift in industry composition put downward pressure on the aggregate labor share, the weighted average labor share across all industries. Second, the services labor share began to rise, closing the gap with manufacturing and putting upward pressure on the labor share. The aggregate labor share remained stable during these five decades because the forces affecting it effectively cancelled each other out.
Chart 1: U.S. Nonfarm Business Sector Labor Share, 1947–2017
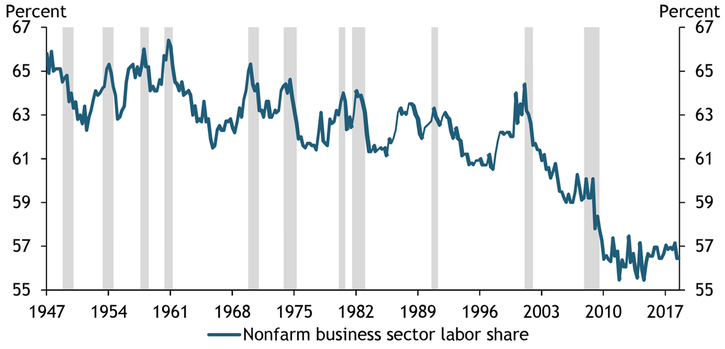
Notes: Gray bars denote National Bureau of Economic Research (NBER)-defined recessions.
Sources: Bureau of Labor Statistics (BLS) and NBER.
However, the labor share of income began to fall rapidly in the early 2000s, reaching a historical low of 56 percent in 2010. Earlier studies have provided various explanations for the declining labor share, from the declining relative price of investment goods, which led firms to shift away from labor and toward capital in production, to the offshoring of labor-intensive components of production to higher product market concentration (Karabarbouris and Neiman 2014; Elsby, Hobijn, and Şahin 2013; Autor and others 2017).
The rapid decline in the labor share of income has slowed down since 2010; in fact, the share has increased slightly to 57 percent as of year-end 2017. We compare the sharp decline in the labor share from 2000 to 2010 to its stabilization after 2010. We analyze the effect of compositional changes across industries as well as changes in the labor share within industries on the aggregate labor share of income.
The labor share’s numerator, labor compensation, has two components: compensation paid to employees and compensation paid to self-employed individuals (“proprietors”). Accordingly, the aggregate labor share of income can be broken down into two components: the employee (or payroll) labor share and the proprietor labor share. We focus our analysis on the changes in the employee labor share for the following reasons. First, industry accounts from the Bureau of Economic Analysis (BEA) allow us to decompose the employee labor share by industry. Second, it is harder to disentangle the labor share from the capital share of proprietors’ income, as discussed in Elsby, Hobijn, and Şahin (2013). Third, fluctuations in the employee labor share more closely echo the cyclical and longer-term movements seen in the aggregate labor share (from the Bureau of Labor Statistics)._
We construct the aggregate employee labor share as the ratio of aggregate employee compensation to aggregate value added in the nonfarm business sector of the economy. The aggregate employee labor share also corresponds to the value-added-weighted sum of the employee labor shares in each industry. In constructing the industry-level employee labor share, we use data for value added and employee compensation from the BEA’s industry accounts._ Because the rapid decline in the aggregate labor share slowed down in 2010, we examine the 2000–10 and 2010–17 time periods separately. As in Elsby, Hobijn, and Şahin (2013), we decompose the change in the aggregate employee labor share, denoted ΔLS, into two components:
The first term represents contributions from changes in labor shares within industries, calculated by multiplying the change in an industry’s employee labor share with its average share in total value added and summing over all industries. The second term shows the contributions from changes in the industry composition of total value added due to shifts between industries, calculated by multiplying the change in an industry’s share of value added with its average employee labor share and summing over all industries.
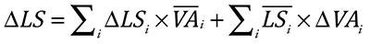
Chart 2 shows changes in the aggregate employee labor share in the two time periods as well as contributions from changes in employee labor shares within industries and shifts in the value-added shares between industries. The left panel shows that the aggregate employee labor share in 2000–10 declined by 5.8 percentage points, and almost all of this decline was accounted for by changes within industries.
Chart 2: Decomposing the Change in the Aggregate Employee Labor Share, 2000–17
Sources: BEA (Haver Analytics) and authors’ calculations.
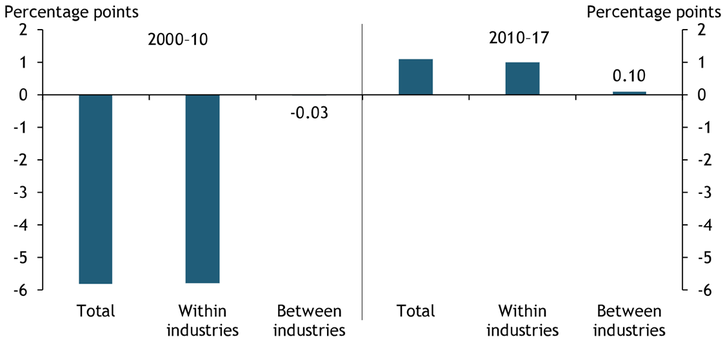
Chart 3 breaks down the contributions from changes within and between industries by industry. In 2000–10, economic activity shifted away from goods-producing industries and trade, transportation, and utilities industries toward professional and business services, education and health services, and financial activities industries. This shift, reflected in contributions from changes between industries, did not affect the aggregate employee labor share because the labor-share-weighted changes in value added were largely offsetting. Therefore, declines in the labor shares across industries, as shown by contributions from changes within industries, accounted for the rapid decline in the aggregate employee labor share in 2000–10. This result is in stark contrast to the second half of the twentieth century, when the contributions from changes within and between industries were cancelling each other out, keeping the aggregate labor share stable.
Chart 3: Decomposing Contributions from “Within” and “Between” Industries, 2000–17
Note: “Goods-producing industries” correspond to the manufacturing, construction, and mining industries, while “other services industries” correspond to the information, leisure and hospitality, and other services industries.
Sources: BEA (Haver Analytics) and authors’ calculations.
Starting in 2010, the rapid decline in the aggregate labor share seems to have slowed down. In fact, the aggregate employee labor share increased by 1.1 percentage points in the 2010–17 period. The contributions from changes between industries show that the shift in economic activity toward services industries continued in the 2010–17 period but at a much slower pace (Chart 3). The contributions from changes within industries show that most industries saw increases in their employee labor shares. However, the services industries had the largest contribution. Similar to the previous period, most of the change in the aggregate labor share was due to changes within industries. More specifically, increases in the employee labor shares across professional and business services, education and health services, and financial activities industries—the industries that account for almost half of all value added—led to a slight increase in the aggregate labor share post-2010.
To summarize, our analysis shows that much of the decline in the aggregate labor share from 2000 to 2010 was driven by declines in the labor shares across all industries. From 2010 to 2017, the labor share seems to have stabilized. This recent trend reflects both the continued shift in economic activity toward services and a more rapid increase in the labor share in services industries than in other industries.
Endnotes
-
1 The U.S. nonfarm business sector excludes general government, nonprofit institutions, private households, the Armed Forces, and farms, and covers 75 percent of the U.S. economy as described in Giandrea and Sprague (2017).
-
2 Based on the data provided in Giandrea and Sprague (2017), the proprietor labor share declines after 2010, implying that the stabilization in the aggregate labor share post-2010 is related to the employee labor share.
-
3 The industry accounts are for the private sector and include nonprofit institutions serving households, which is not included in the aggregate value added and compensation for the nonfarm business sector. Similar to Elsby, Hobijn, and Şahin (2013), we adjust value added and compensation for each industry by rescaling their value to match the aggregate levels in the nonfarm business sector. We then classify industries in the nonfarm business sector into four groups: goods-producing industries (manufacturing, construction, and mining); trade, transportation and utilities industries; professional and business services, education and health services, and financial activities industries; and other services industries (information, leisure and hospitality, and other services).
References
Armenter, Roc. 2015. “External LinkA Bit of a Miracle No More: The Decline of the Labor Share.” Federal Reserve Bank of Philadelphia, Business Review, third quarter, pp. 1–9.
Autor, David, David Dorn, Lawrence F. Katz, Christina Patterson, and John Van Reenen. 2017. “External LinkConcentrating on the Fall of the Labor Share.” American Economic Review, vol. 107, no. 5, pp. 180–185.
Elsby, Michael W.L., Bart Hobijn, and Ayşegül Şahin. 2013. “External LinkThe Decline of the U.S. Labor Share.” Brookings Papers on Economic Activity, Fall, pp. 1–63.
Giandrea, Michael D., and Shawn A. Sprague. 2017. “External LinkEstimating the U.S. Labor Share.” Bureau of Labor Statistics, Monthly Labor Review, February.
Karabarbounis, Loukas, and Brent Neiman. 2014. “External LinkCapital Depreciation and Labor Shares Around the World: Measurement and Implications.” NBER working paper no. 20606, November.
Didem Tüzemen is a senior economist, W. Blake Marsh is an economist, and Thao Tran is a research associate at the Federal Reserve Bank of Kansas City. The views expressed are those of the authors and do not necessarily reflect the positions of the Federal Reserve Bank of Kansas City or the Federal Reserve System.
Author