Over the last two decades, the market for U.S. Treasuries has been characterized by declining Treasury rates, as increases in Treasury supply were met by strong demand. In the early 2000s, the large trade surpluses of emerging market economies created a global savings glut, which in turn increased demand for safe assets such as Treasuries._ The left panel of Chart 1 shows that long-term Treasury yields (light blue line) fell during this period and continued to fall after the 2007–09 global financial crisis (GFC), even as the supply of Treasuries significantly increased (purple line).
Chart 1: U.S. Treasury volume, 10-year Treasury yields, and 10-year term premium since 2000
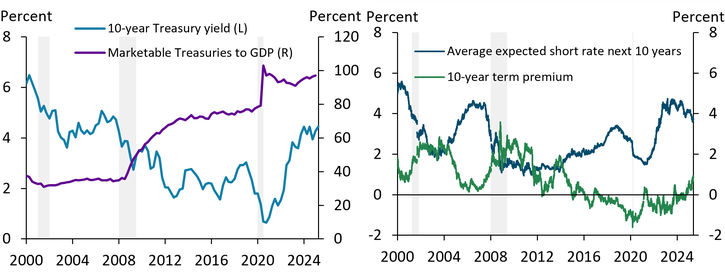
Note: Shaded bars denote National Bureau of Economic Research (NBER)-defined recessions.
Sources: Adrian and others (2014), U.S. Bureau of Economic Analysis, Board of Governors of the Federal Reserve System (Haver Analytics), U.S. Department of the Treasury (FRED), and NBER (Haver Analytics).
A substantial fraction of the changes in long-term yields have been attributed to changes in the term premium—the additional compensation over the expected path of short rates that investors demand to hold long-term debt. The right side of Chart 1 shows that investor demand has been resilient despite rising Treasury supply, as term premiums declined after the GFC and went negative during the pandemic (green line). More recently, as the Fed lowered rates last September (blue line), term premiums have continued to rise, keeping longer-term Treasury rates elevated and leading some observers to suggest that we may be moving away from the era of safe asset shortages and extremely low rates._ Rising term premiums have also focused attention on the changing composition of investor demand.
Historically, foreign investors and the Federal Reserve have been the largest holders of U.S. Treasuries, accounting for over 70 percent of outstanding Treasuries prior to the GFC (blue and purple areas in Chart 2). Although Fed purchases as a share of marketable Treasuries remain range-bound, the share of foreign investors has fallen since the GFC, as illustrated in Part 1 of the series—Foreign Treasury Sales Could Raise U.S. Yields. And while both the Fed and foreign investors have steadily increased the volume of their Treasury holdings since the GFC, their combined share of all marketable Treasuries has recently declined to less than 50 percent. Consequently, an increasing share of U.S. Treasury issuance is being financed by domestic investors (green area).
Chart 2: Marketable U.S. Treasury holdings by entity
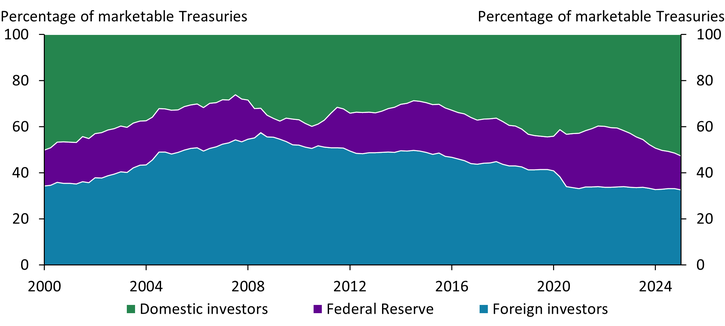
Source: Board of Governors of the Federal Reserve System (Haver Analytics).
As the share of foreign participation waned post-GFC, private domestic investors have increased their holdings, aided by regulatory changes and the collapse of private-label securities. Chart 3 shows that shares of three groups of private domestic investors—banks, money funds, and hedge funds (households)—have accelerated over both the post-GFC and post-pandemic periods._ This growth was driven partly by post-GFC regulation requiring intermediaries to hold safer assets, thereby creating additional demand for U.S. Treasuries. Importantly, the collapse of private-label securitization in the wake of the GFC also helped generate additional Treasury demand._
Chart 3: Average quarterly changes in domestic (non-Fed) U.S. Treasury holdings
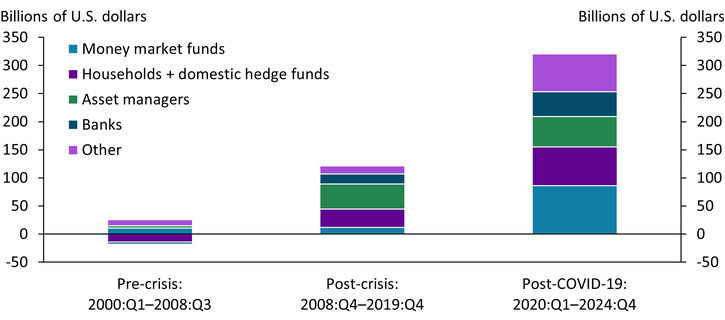
Notes: Asset managers include property and life insurance companies, private pension funds, state/local government retirement funds, mutual funds, exchange-traded funds, and closed-end funds.
Source: Board of Governors of the Federal Reserve System (Haver Analytics).
However, it is unclear whether growing private demand will keep pace with increasing Treasury issuance. Chart 4 shows that the share of U.S. Treasuries on bank, hedge fund, and money fund portfolios (purple dots) are currently at or near their post-2000 peak (blue dots). The post-pandemic range of portfolio shares also remain at the upper end of their post-2000 values, suggesting that recent shares are higher than they have been previously. Although efforts to renew the pandemic-era capital relief for U.S. Treasuries on the supplementary leverage ratio (SLR) will increase large banks’ balance sheet capacity, the willingness of banks to increase portfolio shares is unclear. Banks still have sizeable unrealized losses on securities on their balance sheets. More broadly, investment choices of banks, money funds, and hedge funds are discretionary, and consequently, more interest sensitive. Tilting these investors’ portfolios further toward U.S. Treasuries may require higher risk-adjusted returns.
Chart 4: Historical holdings of U.S. Treasuries as a percentage of total financial assets
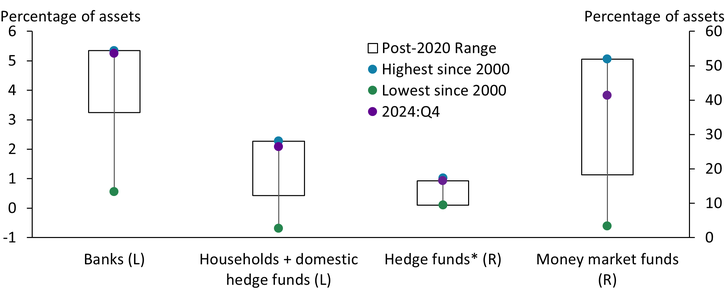
Notes: Banks include U.S. depository institutions, credit unions, banks in U.S. affiliated areas, and foreign banking offices in the United States. Hedge funds include domestic and international funds. The blue and green dots represent the maximum and minimum holdings. Starred hedge fund data ranges from 2012:Q4–2024:Q2; all other data ranges from 2000:Q1–2024:Q4.
Source: Board of Governors of the Federal Reserve System (Haver Analytics).
The growing participation of hedge funds in recent years has also contributed to higher Treasury market volatility. Hedge funds’ derivative trading strategies make for volatile investment demand with sudden pullbacks, as happened in March 2020 (Banegas and Monin 2023). Moreover, they are leveraged with short-term repo funding, exposing them to rollover risk and margin calls. If these funds are thinly capitalized, their lenders (money funds and dealer banks) can be exposed to counterparty risk. In short, hedge fund demand is unstable and makes liquidity strains more frequent in the Treasury market.
Post-crisis demand for U.S. Treasuries has increasingly tilted away from foreign participants toward domestic private investors, driven in part by enhanced post-crisis capital and liquidity requirements and demand for collateral. Without commensurate increases in demand for similar reasons, investors may be limited by their willingness to increase U.S. Treasury purchases over other higher-yielding investments. As the United States issues more debt, these changes are likely to put upward pressure on yields and term premiums and generate greater market volatility. Higher volatility could, in turn, reduce the allure of the U.S. Treasuries as a safe haven.
Endnotes
-
1 Term premiums declined as the FOMC raised rates in 2004 so that 10-year yields remained essentially unchanged despite increases in the expected path of short rates—a phenomenon termed a “conundrum” by Alan Greenspan. The global savings glut hypothesis was offered as an explanation for the conundrum (Bernanke 2015).
-
2 Although term premiums have trended upward, they are still near record lows, indicating robust demand for long-term U.S. debt.
-
3 The fourth group, asset managers, investment funds, and insurance companies, tends to follow relatively passive investment strategies that are less sensitive to rates.
-
4 As safe, liquid assets, U.S. Treasuries can be valued without concerns that the counterparty knows more about the value of the asset (adverse selection). This feature makes U.S. Treasuries valuable as collateral for secured borrowing. Prior to the GFC, a shortage of U.S. Treasuries needed to support an increasingly large volume of short-term funding led to the creation of privately produced safe assets (Gorton 2017). Gorton (2017) argues that the creation of private-label ABS and MBS securities financed by short-term repo was a major factor behind the GFC.
Article Citation
Sengupta, Rajdeep, and Joshua A. Jacobs. 2025. "The Changing Investor Composition of U.S. Treasuries, Part 2: Who’s Buying U.S. Treasuries?" Federal Reserve Bank of Kansas City, Economic Bulletin, July 9.
References
Adrian, Tobias, Richard K. Crump, Benjamin Mills, and Emanuel Moench. 2014. “External LinkTreasury Term Premia: 1961–Present.” Federal Reserve Bank of New York, May 12.
Banegas, Ayelen, and Phillip Monin. 2023. “External LinkHedge Fund Treasury Exposures, Repo, and Margining.” Board of Governors of the Federal Reserve System, FEDS Notes, September 8.
Bernanke, Ben S. 2015. “External LinkWhy Are Interest Rates So Low, Part 3: The Global Savings Glut.” Brookings Institution, April 1.
Gorton, Gary. 2017. “External LinkThe History and Economics of Safe Assets.” Annual Review of Economics, vol. 9, no. 1, pp. 547–586.
Rajdeep Sengupta is a senior economist at the Federal Reserve Bank of Kansas City. Joshua Jacobs is a research associate at the Bank. The views expressed are those of the authors and do not reflect the positions of the Federal Reserve Bank of Kansas City or the Federal Reserve System.
Authors

Rajdeep Sengupta
Senior Economist