After years of substantial declines, ocean shipping costs began to stabilize in 2016 and have recently shown signs of increasing. The increase in shipping costs accelerated following the August bankruptcy of Hanjin Shipping Co., a large South Korean shipping firm. Hanjin’s bankruptcy removed some of the overcapacity in the ocean freight shipping market that had contributed to the decline in shipping prices over the last few years. Chart 1 shows two common indices of shipping costs relevant to U.S. imports: the Shanghai Freight Index and the Harper Petersen charter rate assessment for large vessels._ Both indices show that the costs to ship goods internationally had been falling since 2012 and fell even more steeply since 2015. Specifically, international shipping costs fell by more than 50 percent since their peak in 2012, yet shipping costs have risen by 15 percent over the last few months.
Chart 1: Shipping costs fell in recent years
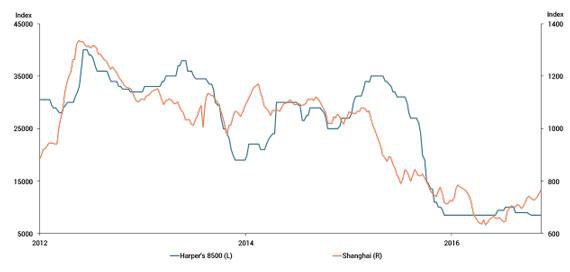
Sources: Shanghai Shipping Exchange (Bloomberg) and Harper Petersen & Company (Thomson Reuters Eikon).
For importers, an increase in shipping costs generates additional cost pressures, creating an incentive for importers to charge higher prices to domestic consumers. These cost pressures can have broad effects on U.S. consumer prices, given that the total volume of U.S. imports is nearly 12 percent of GDP and most traded goods are delivered via ocean freight. U.S. import price indices omit information about shipping costs, so shipping cost pressures act as an additional, but often overlooked, channel through which imports affect aggregate price growth. Chart 2 illustrates the estimated pass-through over a 12-month period of a 5 percent shock in ocean freight costs to U.S. core PCE price inflation year over year._ Changes in shipping costs are measured using the Harper Petersen Charter Rate Index, which aggregates shipping costs across different ocean vessel types.
Chart 2: Higher shipping cost pass-through to U.S. core inflation
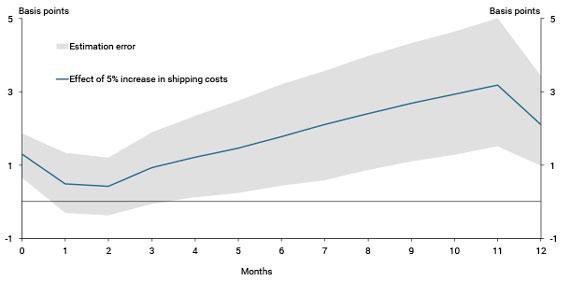
Sources: Bureau of Economic Analysis (Haver Analytics), Chicago Mercantile Exchange (Haver Analytics), Harper Petersen & Company (Thomson Reuters Eikon), and authors’ calculations.
The evidence in Chart 2 suggests a change in shipping costs has a modest but significant effect on core PCE inflation. A shock to shipping prices begins to exert upward pressure on consumer prices after six months, and the effect increases until peaking after 11 months. The nearly year-long delay before importers pass through higher shipping costs to consumers reflects that shipping services ordered today are typically for goods delivered several months in the future, and also that firms may need some time to adjust their prices in response to higher costs.
While modest, the consequences of higher shipping costs for core inflation are not insubstantial. Chart 3 illustrates the additional year-over-year core PCE inflation that would be expected in 2017 and 2018 if the recent rise in ocean freight costs persists or continues. Specifically, Chart 3 plots the additional core inflation that would result from a 5, 15, and 25 percent increase in shipping costs based on the estimated pass-through illustrated in Chart 2; each of these shocks are well within the range of price variation observed in recent years. The gray bar in Chart 3 shows that a 15 percent increase in freight costs in 2016:Q3 would cause core PCE prices to rise by an additional 10 basis points in 2017. As the effect of the shock peaks after one year, core inflation would rise by less than 5 basis points in 2018.
Chart 3: Additional core inflation resulting from shipping cost shocks
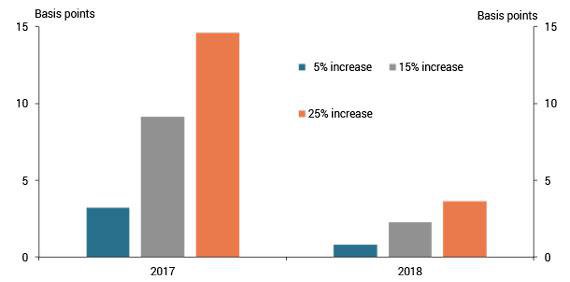
Sources: Bureau of Economic Analysis (Haver Analytics), Chicago Mercantile Exchange (Haver Analytics), Harper Petersen & Company (Thomson Reuters Eikon), and authors’ calculations.
Declines in international shipping costs alleviated some cost pressures for importers over the last few years, limiting the need for importers to raise prices. These declines may have contributed to low levels of core inflation since 2012. However, ocean freight prices have stabilized recently and even begun to rise. Going forward, if shipping prices continue to rise, higher import costs due to shipping prices may put upward pressure on core inflation, even if typical import price indices remain low.
Download Materials
Endnotes
-
1 The two indices illustrated in Chart 1 are the Shanghai Shipping Exchange’s China (Export) Containerized Freight Index and the Harper Petersen charter rate assessment for 8,500 twenty foot equivalent unit ships. A twenty-foot equivalent unit is the standard unit of measurement for containers being shipped.
-
2 The estimates illustrated in Chart 2 correspond to an impulse response function with 68 percent confidence bands constructed from a vector autoregression model using the following variables in the order listed: WTI spot price, the Bureau of Labor Statistics’ (BLS) nonpetroleum import price index, Harper Peterson Charter Rate Index (Harpex), and the core PCE price index. The model is estimated with monthly data from January 2001 to September 2016 and uses natural logs and three lags for each variable. Shocks to the variables are identified using a Cholesky factorization, so a variable ordered before another is not affected contemporaneously by shocks to that variable. The BLS constructs its import price index using free on-board prices that omit shipping costs, which is consistent with import prices being ordered before shipping costs.
Trenton Herriford and Elizabeth M. Johnson are research associates at the Federal Reserve Bank of Kansas City. A. Lee Smith is an economist, and Nicholas Sly is a senior economist at the bank. The views expressed are those of the authors and do not necessarily reflect the positions of the Federal Reserve Bank of Kansas City or the Federal Reserve System.
Authors

Nicholas Sly
Vice President, Economist, and Denver Branch Executive