Colorado made headlines when it became the first state to open recreational marijuana stores in January 2014. Since then, many more states have legalized marijuana even though it remains illegal at the federal level. Chart 1 shows that as of September 2022, a total of 37 states and the District of Columbia have legalized medical marijuana, 20 of which (including Washington, DC) have also legalized recreational marijuana. Within the Tenth Federal Reserve District, both Colorado and New Mexico have legalized medical and recreational marijuana, while Missouri and Oklahoma have legalized medical marijuana only.
Chart 1: Marijuana legalization has expanded across states over time
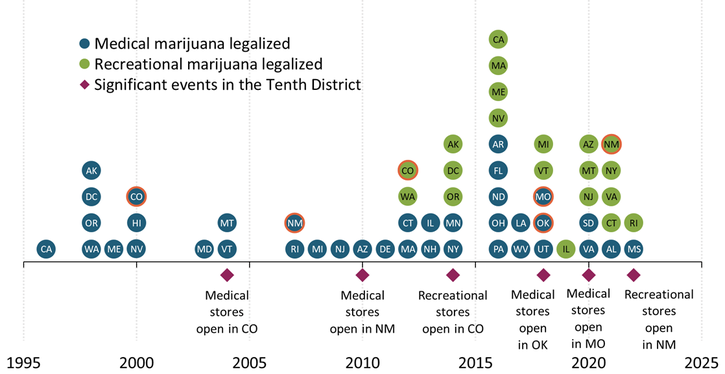
Note: Orange rings denote states in the Tenth District.
Sources: National Conference of State Legislatures and MJBizDaily.
This expansion may continue in the years to come. In November, Missouri voters will decide whether they want to legalize recreational marijuana (Herrington 2022). Marijuana industry advocates also collected signatures for marijuana-related ballot initiatives in Nebraska and Oklahoma, but those measures will not appear on voter ballots this year (Hammel 2022; Monies 2022).
If these expansion efforts succeed, they may have important implications for the Tenth District economy. Although the size of the District’s marijuana industry has thus far remained moderate, the industry has already influenced employment, real estate, and tax revenue in legalized states.
Currently, employment in the marijuana industry makes up a small share of total employment in Tenth District states, with estimates ranging from less than 0.30 percent of total employment in Missouri to around 1.35 percent of total employment in Colorado (Cox 2022; Barcott and Whitney 2022)._ Although this share is relatively small, new jobs in the marijuana industry can nevertheless contribute substantially to total employment growth, particularly in the years immediately following legalization. For example, Colorado issued around 38,000 occupational licenses in the first four years after legalization, 2014–17 (Felix 2019). During the same period, Colorado added a total of 280,000 new jobs across all industries, suggesting that employment in the marijuana sector may have contributed up to 13.6 percent of the state’s employment growth._ However, this growth has moderated more recently. From 2018 to 2022, new occupational licenses equated to around 3 percent of total employment growth in Colorado. Outside of Colorado, the Tenth District marijuana industry is much newer (see Chart 1). Thus, Tenth District employment growth in the marijuana industry may moderate in the coming years as the industry matures in other states and the initial wave of strong hiring to open retail stores, grow product, and manufacture edibles slows to a more moderate pace.
The marijuana industry has also tightened real estate markets nationwide, including in Tenth District states. Marijuana businesses have looked to snap up industrial and retail space, and some residential realtors have reported an increase in all-cash offers. According to a 2019 survey conducted by the National Association of Realtors, 23 percent of realtors located in states that had legalized both medical and recreational marijuana prior to 2016 reported that residential inventory had tightened due in part to all-cash purchases from the marijuana industry. In these same states, 27 percent of respondents reported increased demand for storefronts, 21 percent reported stronger demand for land, and 42 percent reported higher demand for warehouses (Yun and others 2020). A 2015 report from CBRE found that the marijuana industry accounted for almost 36 percent of Denver’s total net absorption in industrial space from 2009 to 2014 and occupied about 2.6 percent of total warehouse space in Denver (Murtaugh and Ostermick 2015). By the end of 2016, the marijuana industry had expanded to occupy 2.9 percent of total warehouse space in Denver; however, grow operations were solely located in older or less developed Class B and C industrial space (Murtaugh and Vance 2017)._ Thus, while the entrance of the marijuana industry is likely to tighten the market for industrial space, it may also help to reduce vacancies in less desirable properties. In particular, CBRE notes that the effect on commercial real estate in markets outside Colorado will depend on regulations (for example, whether marijuana can be grown on farms or in greenhouses in addition to warehouses), zoning laws, and the tightness of the Class B and C industrial market prior to legalization (Murtaugh and Vance 2017).
In addition to employment and real estate, the marijuana industry has also influenced state tax revenue through marijuana sales. Although sales in the Tenth District are strong, they vary considerably across states due in part to differences in consumer demand, state regulations, and the cost and ease of permitting. With the most well-established marijuana industry in the District and perhaps in the nation, Colorado has much higher marijuana sales than other District states, totaling more than $2.2 billion in 2021. Although this number initially looks substantial, total marijuana sales in Colorado still make up less than 1 percent of total consumer spending in the state._ For a state with only medical sales, Oklahoma has a surprisingly large amount of sales as well, with an estimated $945 million in sales in 2021 (Wallis 2022)._ These strong sales are likely due in part to less stringent regulations for the marijuana industry in Oklahoma, including the licensing for both businesses and patients. About 9.3 percent of Oklahoma residents have a medical I.D. card, which requires a physician’s signature; however, unlike other states, the issuance of the I.D. card is not restricted to specific underlying health conditions. Business licenses also have been relatively easy and cheap to attain in Oklahoma, leading the state to have more retail marijuana stores than in Colorado, Oregon, and Washington combined and the largest number of licensed marijuana farms (over 9,000) in the country (Romero 2021). However, Oklahoma legislators recently passed a moratorium on the issuance of new marijuana business licenses that is expected to remain in place through August 2024 (Schiller 2022). As a result, sales growth may moderate in the years to come.
As marijuana sales have picked up in the Tenth District, state and local government coffers have also grown. Tax rates on marijuana vary significantly across states, with taxes typically much higher for recreational sales than medical sales. Among the Tenth District states, Colorado brought in the most from marijuana sales taxes, excise taxes, and licensing fees in 2021, with revenue totaling more than $423 million. The marijuana industry generated almost $150 million in revenue for Oklahoma in 2021; about $50 million in revenue is projected in New Mexico’s first year of recreational sales (medical marijuana sales are exempt from the excise tax); and less than $10 million has been collected since sales began in Missouri._ Although these revenues have benefited Tenth District states and earmarked projects such as education and veteran services, tax revenues from marijuana remain a small share of overall state and local government revenues. Even in Colorado, which has the highest revenues, marijuana revenue made up just 2.3 percent of state tax revenue in 2021.
Overall, the marijuana industry has had a significant effect on the economies of Tenth District states in the initial years after legalization. The emergence of the industry has led to higher employment and stronger demand for commercial real estate. In addition, tax revenues have increased as marijuana sales have grown. However, marijuana legalization has also been associated with challenges for both the industry and localities more broadly, including access to banking services and concerns among some local officials about its effects on public health and safety.
Endnotes
-
1 Precise counts of employment in the marijuana industry do not exist. These estimates rely on data from Barcott and Whitney (2022) and state occupational licensee data.
-
2 These estimates assume that all occupational licenses led to new jobs in the marijuana industry. Previous work by the Marijuana Policy Group estimated that each occupational license equates to 0.467 full-time employment positions (Light and others 2016). Using their estimate, the marijuana industry may have accounted for a much smaller share of employment growth between 2014 and 2017, 6.4 percent.
-
3 Commercial real estate is typically divided into three classes. Class A spaces tend to be the newest buildings with state-of-the-art facilities. Class B spaces are slightly below Class A properties and are frequently slightly older. Class C spaces tend to be substantially older and more out of date.
-
4 According to data from the Bureau of Economic Analysis, marijuana sales in 2020 and 2021 were both less than 1 percent of 2020 personal consumer expenditures in Colorado.
-
5 Total marijuana sales in 2021 made up less than 0.7 percent of personal consumption expenditures in Oklahoma in 2020 (the most recent year for which data are available).
-
6 We calculate Oklahoma tax revenue by adding state and local sales tax data to SQ 788 excise tax data from the Oklahoma Medical Marijuana Authority.
References
Barcott, Bruce, and Beau Whitney. 2022. External LinkJobs Report 2022. Leafly.
Cox, Lisa. 2021. “External Link$6.8 Million from State’s Medical Marijuana Program Transferred to Veterans Fund.” Missouri Department of Health and Senior Services, news release, September 16.
Felix, Alison. 2019. “External LinkIs the Colorado Marijuana Industry Showing Signs of Maturation?” Federal Reserve Bank of Kansas City, Rocky Mountain Economist, December 31.
Hammel, Paul. 2022. “External LinkFederal Appeals Court Rejects Nebraska Medical Marijuana Campaign’s Challenge To Ballot Initiative Rules.” Marijuana Moment, September 1.
Herrington, A.J. 2022. “External LinkMissouri Voters Will Decide on Legalization of Recreational Marijuana in November.” Forbes, August 10.
Light, Miles, Adam Orens, Jacob Rowberry, and Clinton W. Saloga. 2016. “The Economic Impact of Marijuana Legalization in Colorado.” Marijuana Policy Group, October.
Monies, Paul. 2022. “External LinkWhy Recreational Marijuana Isn’t On the November Ballot.” Oklahoma Watch, September 26.
Murtaugh, Katie, and Jessica Ostermick. 2015. “External LinkMarijuana Real Estate in Denver: The Early Years.” CBRE, ViewPoint, September 22.
Murtaugh, Katie, and Matt Vance. 2017. “Three Years After Legalization…Marijuana Real Estate in Denver.” CBRE, June.
Romero, Simon. 2021. “External LinkHow Oklahoma Became a Marijuana Boom State.” New York Times, December 29.
Wallis, Beth. 2022. “External LinkStriking Gold in the Green Rush: Entrepreneurs Tap into Oklahoma’s Weed Economy.” State Impact Oklahoma, April 21.
Yun, Lawrence, Jessica Lautz, Brandi Snowden, and Matt Christopherson. 2020. External LinkMarijuana and Real Estate: A Budding Issue. National Association of Realtors Research Group, February.
The views expressed are those of the authors and do not necessarily reflect the positions of the Federal Reserve Bank of Kansas City or the Federal Reserve System.
Author