Several current events in the United States and abroad are affecting production and income in the U.S. agricultural sector. Supply chain disruptions have put upward pressure on farm costs, extreme weather events have challenged agricultural production, and government transfers from pandemic stimulus programs—which boosted farm income by around 30 percent in 2020—have declined._ As a result, the U.S. Department of Agriculture projects a 5 percent year-over-year decline in farm income in 2022. The projected decline in farm income may be even higher if supply chain disruptions worsen as a result of the Russia/Ukraine conflict.
As farmers adjust their credit needs in response, banks with a high share of agricultural loan activity (“ag banks”) may see demand for loans increase._ Chart 1 shows that over the last 10 years, changes in farm income (blue line) have been negatively associated with changes in ag bank loans (green line). When farmers have more income, their demand for ag loans declines, as they are able to finance their operations with money they have on hand. In contrast, when farmers are cash-constrained, they tend to rely on debt to finance production.
Chart 1: When farm income increases, the value of ag loans at ag banks declines
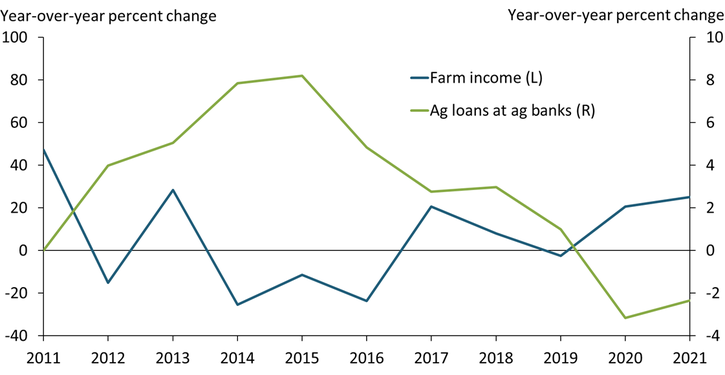
Sources: U.S. Department of Agriculture (USDA) and the Federal Financial Institutions Examination Council (FFIEC).
Historically, ag banks’ net interest margins (NIMs) have also benefited from periods of higher demand for loans arising from a decline in net farm income._ Chart 2 shows that net farm income (blue line) has been negatively associated with the median NIM of ag banks (green line). When farmers’ income surges—generally from rising commodity prices or large government transfers—ag banks’ NIMs trend down. When the agricultural sector received massive government transfers in 2020, the median ag bank NIM decreased by more than 200 basis points. If the USDA’s projected decline in farm income materializes in 2022 (blue dot), and farm demand for loans increases, ag banks’ NIMs are likely to improve.
Chart 2: When farm income increases, ag banks’ net interest margins decline
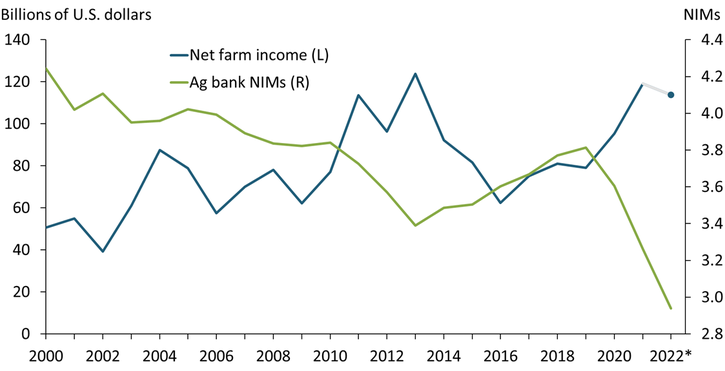
Notes: Projected net farm income for 2022 is represented by a blue dot. Ag bank NIMs are calculated as the median NIM across all banks and quarters in a year, with the median NIM plotted for the first quarter of 2022.
Sources: USDA and FFIEC.
Ag bank NIMs may benefit from the Federal Reserve’s current tightening as well. Chart 3 shows that the median NIM of ag banks (green line) tends to rise along with the federal funds rate (blue line). During periods of rising interest rates (gray bars), interest-bearing liabilities (such as deposits) tend to drag down ag banks’ NIMs because they increase interest expenses. However, this increase tends to be more than offset by banks’ ability to reprice their interest-bearing assets (such as loans and securities). Overall, historical patterns suggest that the Fed’s efforts to cool inflation by raising the federal funds rate should improve NIMs at ag banks.
Chart 3: Historically, ag bank NIMs follow the path of the federal funds rate
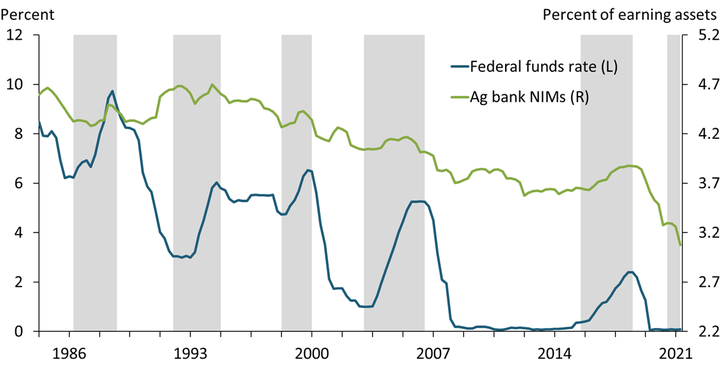
Notes: The quarterly federal funds rate is calculated using data up to April 2022. Ag banks NIMs are calculated as the median NIM across all banks and quarters in a year, with the median NIM plotted for the first quarter of 2022.
Sources: FFIEC and FRED (Federal Reserve Bank of St. Louis).
Although higher interest rates and a decline in farm income may drive up ag banks’ NIMs, competition within and outside of the banking sector may limit the size of the increase. Competitive pressure reduced ag banks’ share of the agricultural loan market from 46 percent in 2000 to 36 percent in 2020. These pressures may continue to increase: from 2019 to 2022, the median value of deposits at ag banks increased by 38 percent, which may induce more competition between banks and cap their ability to reprice loans. Competitive pressure from nonbank institutions has also been strong. To hold on to borrowers, banks seeking to convert deposits to loans may not increase interest rates as much as they could, particularly because many borrowers are also seeking loans from nonbank ag lenders such as the Farm Credit System.
If the relationships between farm income and agricultural loans, farm income and ag bank NIMs, and short-term interest rates and ag bank NIMs over the last two decades persist, current global events could improve ag banks’ margins. However, unless demand for agricultural loans proves especially strong, ag banks’ ability to reprice loans may be capped by competition within the banking system and with nonbank lending institutions. Ultimately, commodity prices and the intensity and duration of supply chain disruptions will determine how much credit farmers need during the next few planting seasons, and, in turn, determine the outlook for ag banks.
Endnotes
-
1 USDA projections for farm income were released in February 2022, before the beginning of the Russia/Ukraine conflict.
-
2 I classify ag banks as banks that have more than 25 percent of their loan volume allocated to agricultural loans. Studies that document the relationship between demand and supply for lending and farm income include Briggeman, Towe, and Morehart (2009), Hesser and Schuh (1962), Hubbs and Kuethe (2017), and Scott and others (2022).
-
3 NIMs are a measure of bank profitability expressed as a percentage, and are calculated by subtracting interest expenses from interest income and dividing by the value of earning assets.
References
Briggeman, Brian C., Charles A. Towe, and Mitchell J. Morehart. 2009. “External LinkCredit Constraints: Their Existence, Determinants, and Implications for U.S. Farm and Nonfarm Sole Proprietorships.” American Journal of Agricultural Economics, vol. 91, no.1, pp. 275–289.
Hesser, Leon F., and G. Edward Schuh. 1962. “External LinkThe Demand for Agricultural Mortgage Credit.” Journal of Farm Economics, vol. 44, no. 5, pp. 1583–1588.
Hubbs, Todd, and Todd Kuethe. 2017. “External LinkA Disequilibrium Evaluation of Public Intervention in Agricultural Credit Markets.” Agricultural Finance Review, vol. 77, no. 1, pp. 37–49.
Scott, Francisco, Todd Kuethe, Ty Kreitman, and David Oppendhal. 2022. “External LinkThe Supply and Demand of Agricultural Loans.” Federal Reserve Bank of Kansas City, Research Working Paper no. 22-06, July.
Francisco Scott is an economist at the Federal Reserve Bank of Kansas City. The views expressed are those of the author and do not necessarily reflect the positions of the Federal Reserve Bank of Kansas City or the Federal Reserve System.
Author