New COVID-19 cases in China have risen sharply in 2022, causing China to implement the largest lockdown since the initial Wuhan shutdown in 2020. Chart 1 shows that new COVID-19 cases increased by more than 10 times from late February to April 2022, triggering a lockdown in late March. The current lockdown covers Shanghai, the most populous city in China and the busiest seaport in the world, raising concerns about potential repercussions on the global supply chain.
Chart 1: New COVID-19 cases have risen sharply in China in 2022
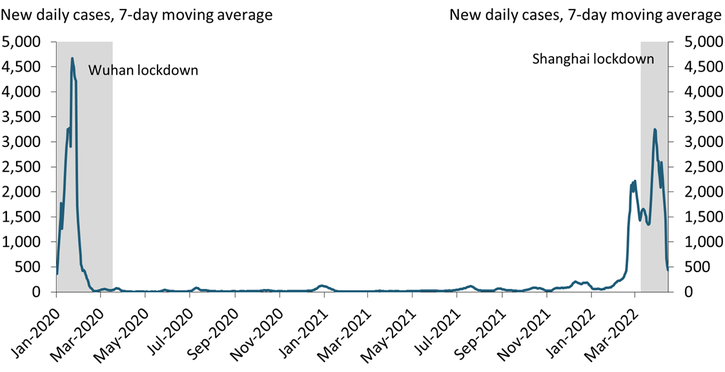
Source: WIND.
To compare the effects of the current and past lockdowns on economic activity, I use daily congestion indexes, which measure the vehicle travel density in major Chinese cities. Higher values of the indexes imply more vehicles on the road, and lower values imply the opposite. Chart 2 shows congestion indexes for Shanghai (green line), Wuhan (orange line), and the nation as a whole (blue line). To facilitate comparison, I normalize the indexes using their average levels in 2018–22 as the daily data are highly volatile.
Chart 2: Congestion indexes show the current lockdown in Shanghai has been less severe
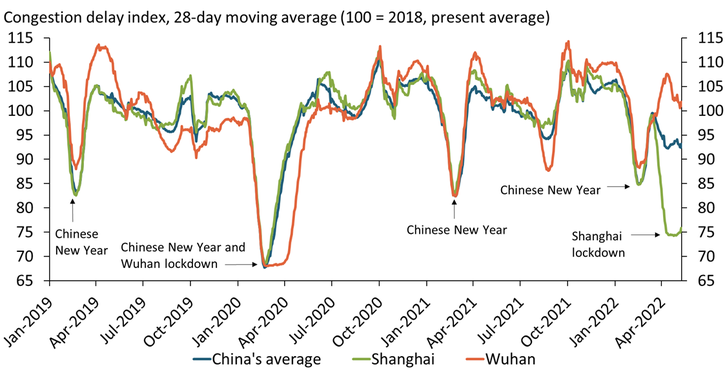
Note: The national congestion index is constructed using a GDP-weighted measure of the 10 Chinese cities with the highest total output.
Source: WIND.
Comparing the indexes reveals three findings. First, congestion usually drops about 15 percent around the Chinese New Year, when most residents do not work, and then quickly bounces back, suggesting congestion is highly correlated with economic activity in China. Second, the congestion index shows that the 2020 lockdown in China, which coincided with the Chinese New Year, was especially severe. The blue line shows that congestion nationwide dropped more than 30 percent from late January to late February 2020, nearly doubling the decline from the previous Chinese New Year in 2019. The orange line shows that while Wuhan experienced a similar drop in congestion during this period, congestion remained at this low level for an extended period, reflecting the two-month lockdown. Third, the current Shanghai lockdown, which started at the end of March, appears to be more localized and slightly less severe than the Wuhan lockdown. The green line shows that congestion in Shanghai declined in March 2022 to a level about 25 percent below its historical average. The national index (blue line) also declined by about 10 percent, reflecting that many other cities in China tightened restrictions or imposed partial lockdowns in response to the developments in Shanghai. However, the national index has fallen by much less than it did in response to the Wuhan lockdown, suggesting the Shanghai lockdown has been more localized and less synchronized with other cities.
Monthly export data from China show a similar pattern. Chart 3 shows that growth in the value of exports from China declined by more than 30 percentage points in February 2020, reflecting both the effects of the Chinese New Year and the effects of the Wuhan lockdown. Although the 2022 lockdown has caused some deceleration in export growth in China, the decline appears to be smaller relative to the decline in February 2020 even accounting for the coincident effects of the 2020 Chinese New Year. Thus, the current lockdown may have a smaller effect on trade activity and the global supply chain than the 2020 lockdown.
Chart 3: Export growth also declined in recent months in China
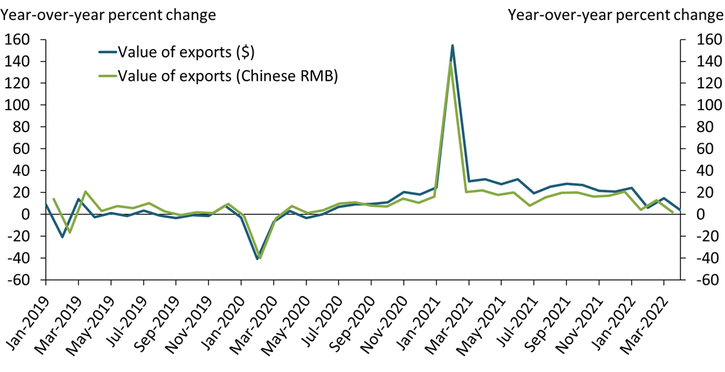
Source: WIND.
Price data support this argument, as the recent lockdown in Shanghai does not yet seem to have pushed up shipping costs. Chart 4 shows that shipping costs from Shanghai to both Los Angeles and New York, the two major ports in the east and west coasts, have continued to decline in recent months after peaking in 2021:Q3. Although shipping costs to both cities are still significantly higher than their pre-pandemic levels, they have been declining steadily. One possible explanation for this continued decline despite the lockdown is that China has prioritized production when implementing its zero-COVID policy to maintain growth.
Chart 4: The current lockdown in Shanghai has not pushed up shipping costs
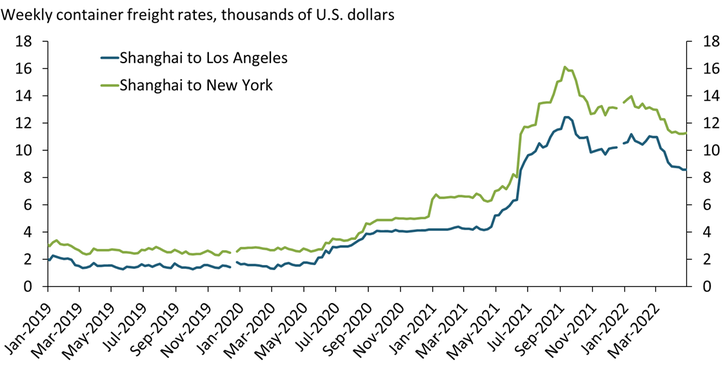
Note: The two gaps in the series reflect missing data at the end of December 2019 and December 2021, respectively.
Source: Drewry World Container Index.
Current lockdowns in China are still likely to weigh on the global supply chain, as China accounts for 30 percent of total world output. However, early evidence suggests that disruptions from the current lockdown might be less severe than the lockdown in 2020, likely due to two factors. First, although many local governments in China have tightened their COVID-19 restrictions following the Shanghai lockdown, these responses have been less synchronized relative to the Wuhan lockdown in 2020. Second, the Chinese government may have prioritized production to maintain growth despite restrictive COVID-19 policies. However, uncertainty remains high given the high transmissibility of the new COVID-19 variants and possible further lockdowns in China. If the lockdown lasts for a much longer period or extends to more regions, the impact could be larger.
Jun Nie is a senior economist at the Federal Reserve Bank of Kansas City. The views expressed are those of the author and do not necessarily reflect the positions of the Federal Reserve Bank of Kansas City or the Federal Reserve System.