Nebraska’s labor market has remained strong through the first quarter of 2025 and faces more limited risk from trade policy uncertainty than other states. While all goods-producing industries have substantial exposure to international trade, the largest industries in Nebraska tend to have lower exposure to international trade than goods-producing industries more prominent elsewhere. Thus, while increased trade policy uncertainty raises questions about potential implications for employment and income, impacts in Nebraska might be more limited.
Employment in Nebraska remained strong in the first quarter of 2025, building on growth in recent years. As of February, employment in the state was 12 percent higher than in 2010 (Chart 1). Job growth in goods-producing industries has expanded by more than twice that level, with employment 24 percent higher than in 2010. While total employment growth in Nebraska lagged the United States, perhaps due to slower population growth or lower labor force participation for younger workers, growth in Nebraska’s goods-producing industries outpaced growth for the nation.
Chart 1: Employment

Sources: BLS, Haver Analytics.
Alongside steady employment growth, wages have also grown substantially. Real (inflation-adjusted) wages in both Nebraska and the United States as a whole have increased by more than 50 percent over the past fifteen years (Chart 2). Similar to employment, wage growth among goods-producing industries has been particularly robust in Nebraska, with inflation-adjusted wages more than 60 percent higher than in 2010 as of early 2025. Nationally, approximately 70 percent of personal income has come from wages or salaries earned at work, so any disruption to employment could impact wage growth moving forward.
Chart 2: Real Wages

Note: Goods-producing wages are converted into real terms by the author.
Sources: BLS, BEA, Haver Analytics.
Despite the strength of Nebraska's labor market, recent uncertainty related to trade policy raises questions about potential effects on businesses and their level of employment. Policy uncertainty indexes track how often U.S. newspapers mention policy-related uncertainty. In March 2025, economic policy uncertainty rose as uncertainty surrounding trade policy increased substantially. In fact, an index specifically tracking trade policy uncertainty was nearly three times its previous peak in 2019 (Chart 3). The creators of the index have found that elevated uncertainty – often coinciding with close elections, national security events, and Congressional disputes – is associated with greater volatility in markets and reduced investment and employment in a multitude of sectors (Bloom, et all 2016).
Chart 3: Economic Policy Uncertainty

Source: Baker, Bloom and Davis (PolicyUncertainty.com)
Data on direct trade flows suggest that both exports and imports have comprised a small share of Nebraska’s economy. Exports from Nebraska have fallen steadily but comprise about 4 percent of state GDP according to official data (Chart 4). Imports to Nebraska have remained steadier, amounting to approximately 3 percent of state GDP as of 2024. However, uncertainty arising from changes to trade policy might be larger than these data suggest. For states like Nebraska, official data likely undercount exports_ originating from the state and imports_ bound for the state. Some exports, instead, are attributed to the port of exit and the final location of imports is often not known at the port of entry.
Chart 4: International Trade

Sources: Wiser Trade, BEA, Haver Analytics.
Industry specific data at the national level, however, show that the importance of foreign markets for goods-producing industries has varied widely. Among the ten largest goods-producing industries, exports have ranged from 8.4 percent of GDP_ for food and beverage manufacturers to more than 55 percent for computer and electronics manufacturers (Chart 5). However, though food and beverage manufacturers have tended to export less of their final product than other goods-producers, the 8.4 percent of production purchased by foreign consumers is nonetheless substantial. Foreign tariffs or other trade barriers that impact a food manufacturer could potentially disrupt businesses with nearly one-tenth of the business’ customer base.
Chart 5: Export Exposure, 2022-23 Average

Notes: Chart shows ten largest goods-producing industries by share of U.S. employment, indicated by numbers in parentheses. “Farming” includes both crop (NAICS 111) and animal (112) production. “Forestry, fishing, and ag support” includes NAICS 113, 114, and 115. “Food and Bev. Mfg.” includes both food manufacturing (311) and beverage and tobacco manufacturing (312).
Sources: Census Bureau, BEA, Haver Analytics, authors’ calculations.
Goods-producers in the United States have also relied on foreign suppliers to varying degrees. For specific industries, such as machinery manufacturers, a range of products is used in the production process. On average, two of the largest inputs for machinery manufacturers in 2022 and 2023 were primary metal products (like steel and aluminum) and other (intermediary) machinery products (Chart 6, Panel A). A substantial amount of these inputs is estimated to have been imported. For example, 35 percent of the $50 billion primary metal inputs, and 58 percent of the $40 billion of machinery inputs, were estimated to have been imported by U.S. manufacturers. After accounting for all such inputs, the import exposure of supply chains_ across industries varies from about 14 percent for food and beverage manufacturers to nearly 57 percent for computer and electronics manufacturers (Chart 6, Panel B). Thus, not only are goods-producers likely concerned about markets for their final products abroad, but also concerned about trade disruptions impacting their foreign suppliers.
Chart 6: Import Exposure, 2022-23 Average

Notes: Panel A shows ten largest goods-producing industries by share of U.S. employment. “Farming” includes both crop (NAICS 111) and animal (112) production. “Forestry, fishing, and ag support” includes NAICS 113, 114, and 115. “Food and Bev. Mfg.” includes both food manufacturing (311) and beverage and tobacco manufacturing (312).
Sources: Census Bureau, BEA, Haver Analytics, authors’ calculations.
In Nebraska, however, industries with relatively low exposure to international trade have accounted for a greater share of both employment and income. These industries accounted for 8 percent of employment and 7 percent of income in the state on average in 2022 and 2023 (Chart 7). Industries with lower exposure to trade – those where export exposure to final products or import exposure to supply chains has been below the national average – include farming, food and beverage manufacturing, and nonmetallic mineral manufacturing, among others_. In contrast, industries with a higher exposure to trade – those industries where export and import exposure is above the national average – have accounted for a higher share of income and employment in Nebraska than the United States as a whole_. Industries with higher exposure to trade include firms involved in the production of machinery, fabricated metals, transportation equipment, and computers and electronic devise, among others.
Chart 7: Employment and Income by Trade Exposure, 2022-23 Average

Note: Industries with higher exposure are those where exports’ share of industry output or imports’ share of inputs used is greater than the national average. Industries with lower exposure are those where exports’ share of industry output and imports’ share of inputs are both below the national average. See endnotes 4 and 5 for a full list.
Sources: Census Bureau, BEA, Haver Analytics, authors’ calculations.
Initial disruptions from adjustments to trade policy could impact several counties in Nebraska where employment in industries with higher exposure to international trade has been somewhat concentrated. Employment in more highly exposed industries has represented a significant share of employment in a handful of counties, such as Hall and Platte Counties (Map 1). In these areas, employment has been concentrated in fabricated metal manufacturing or machinery production. Throughout the country, there are other similarly concentrated regions, especially around the Great Lakes. The areas first to see impacts to employment or income from changes to trade policy might be those where employment is slightly more concentrated in industries more exposed to international trade.
Map 1: Industries with Higher Exposure to Trade, 2022-23 Average

Note: Industries with higher exposure are those where exports’ share of industry output or imports’ share of inputs used is greater than the national average.
Sources: Census Bureau, BEA, Haver Analytics, authors’ calculations.
Though uncertainty has increased in recent months, particularly in relation to trade policy, labor markets in Nebraska appear to remain strong. A greater portion of the state’s employment and income has come from goods-producing industries that are less reliant on international trade. However, prolonged or unexpected disruptions to international trade could still pose a significant risk to labor markets on the state depending on the nature of those disruptions.
Endnotes
-
1 The Census Bureau notes External Linksome limitations to state-level international trade data. In particular, for exports, noting that “in certain cases, the origin of movement is not the transportation origin. Whenever shipments are consolidated, the state of origin will reflect the consolidation point. This effect is particularly noticeable for agricultural shipments.”
-
2 Regarding imports, the Census Bureau continues to External Linkdetail limitations of international trade data: “In certain cases, the state of destination may not reflect the final location for which the imported goods are destined. Rather for these shipments, the state of destination, as known at the time the entry documentation is filed, may reflect an intermediary, storage or distribution point. From there, these shipments may later be distributed to another location in another state as the ultimate destination.”
-
3 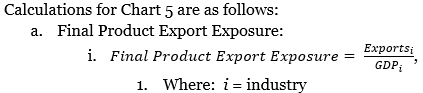
-
4 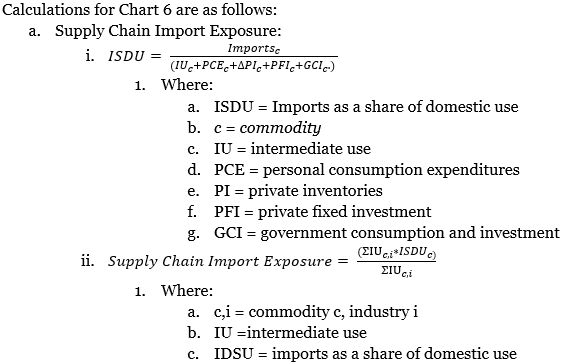
-
5 Lower Exposure Industries: farming; forestry, fishing, and support activities for agriculture; food and beverage manufacturing; wood product manufacturing; printing and related; paper product manufacturing; nonmetallic mineral product manufacturing; furniture product manufacturing.
-
6 Higher Exposure Industries: oil and gas extraction; textile mills and product manufacturing; apparel and leather manufacturing; petroleum and coal product manufacturing; chemical product manufacturing; plastics and rubber product manufacturing; primary metal manufacturing; fabricated metal manufacturing; machinery manufacturing; computer and electronic product manufacturing; electrical equipment, appliance, and component manufacturing; transportation equipment manufacturing; and miscellaneous manufacturing.
Reference
Bloom, Scott R., Nicholas Bloom, and Steven J. Davis. 2016. “Measuring Economic Policy Uncertainty.” The Quarterly Journal of Economics, Vol. 131, Issue 4.
The views expressed are those of the authors and do not necessarily reflect the positions of the Federal Reserve Bank of Kansas City or the Federal Reserve System.
Authors

John McCoy
Associate Economist
