The major components of Oklahoma’s 2020-21 population growth reveal two standout trends. For the first time in its history, more people died in Oklahoma than were born, a pandemic reality seen in many other states. Second, more people moved into Oklahoma from other states than any time in recent decades, reversing a recent trend of outmigration—especially of college graduates—and more than offsetting the state’s decline in natural population growth. This edition of The Oklahoma Economist explores underlying data on Oklahoma deaths and migration to shed light on the people the state has lost and gained during the COVID-19 pandemic.
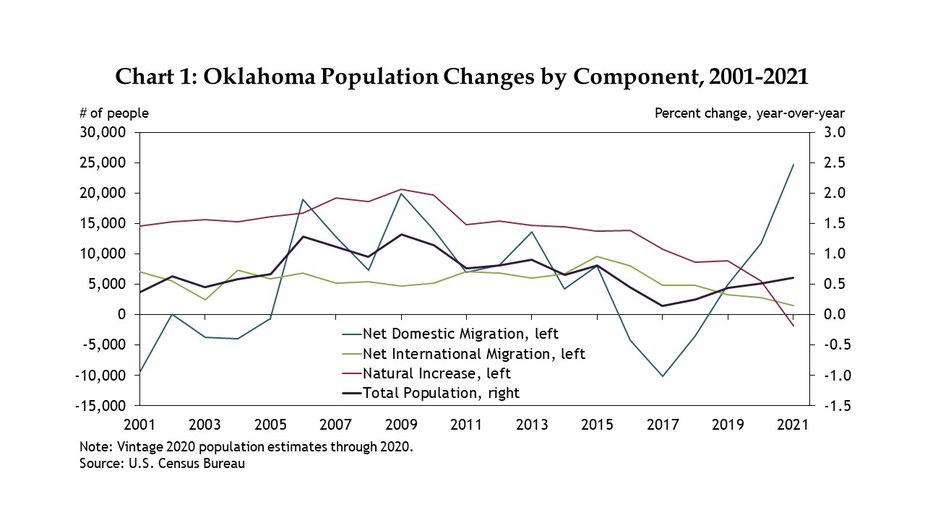
Oklahoma’s total population grew 0.6% in 2021, the fastest rate since 2015 but slower than the rate from 2005 to 2015 (Chart 1)._ In comparison, the total U.S. population grew just 0.2% in 2021. Population growth is affected by three things: natural population growth (births minus deaths), net international migration (from other countries), and net domestic migration (from other states). Oklahoma’s net gains from international immigration have been declining slowly since 2015—similar to the nation and most other states—and this source added only about 1,500 residents to the state’s population in 2021. By contrast, the other two components of Oklahoma’s population growth—natural growth and domestic migration—each exhibited sharply diverging trends from just a few years ago.
A Large Increase in Early Deaths
Half of the 50 states, including Oklahoma, had a natural decrease in population for the year ended July 1, 2021 (the annual reference period for the U.S. Census Bureau), which means more people died than were born in those states. Oklahoma’s number of births in that period was down slightly from the previous 12-month period, continuing a slow decline that began in 2016. Meanwhile, deaths in the state jumped significantly.
The Oklahoma State Department of Health has more up-to-date births and deaths data, including preliminary data for the entire calendar year of 2021 and full data for the past 100 years._ These show that Oklahoma deaths first exceeded births—but just slightly—in calendar year 2020 (Chart 2). That year 47,617 people were born in the state, fewer than in 2019, while 47,734 died—an increase of 17%, or nearly 7,000 from 2019. Then in 2021, Oklahoma births were largely unchanged from 2020, while deaths rose even further, to above 50,000.
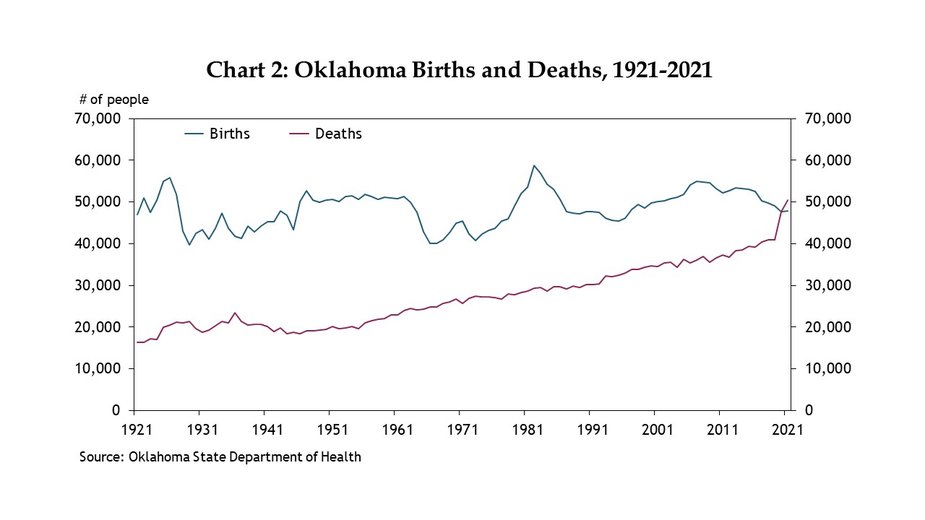
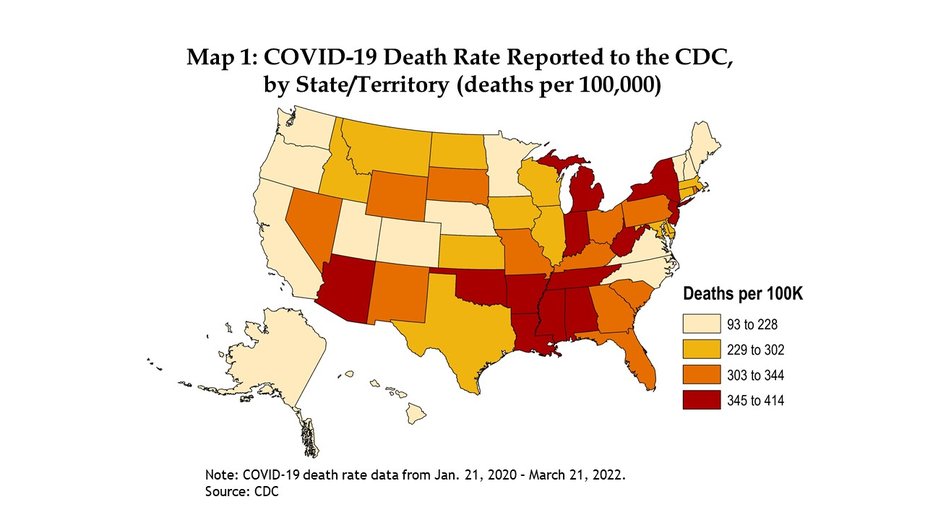
For 2020 and 2021 combined, about 20% more Oklahomans died than in 2018 and 2019 combined (an increase of over 16,000 deaths). This increase was unlike any previous episode in the past 100 years. On average since 1921, about 250 more Oklahomans have died each year than in the previous year, with the three highest previous annual increases (of between 1,750 and 3,000) all happening before World War II. Deaths in Oklahoma jumped again in early 2022 with the Omicron variant, and through March 21, 2022, Oklahoma ranked in the top quarter of states in terms of COVID-19 deaths per capita since the pandemic began (Map 1)._
Oklahoma’s spike in deaths the past two years was not limited just to the state’s oldest citizens. Rather, the death rate was up considerably for nearly all age groups compared with 2018 and 2019. Total deaths rose the most—by over 4,600—among Oklahomans ages 65 to 74, while the largest percentage increase in deaths—35%—was for those 35 to 44 (Chart 3). The rise in deaths among those 55 to 64 was also nearly as large as for those 85 and older. Even among Oklahomans 25 to 34 there were 25% more deaths in 2020 and 2021 than in 2018 and 2019.
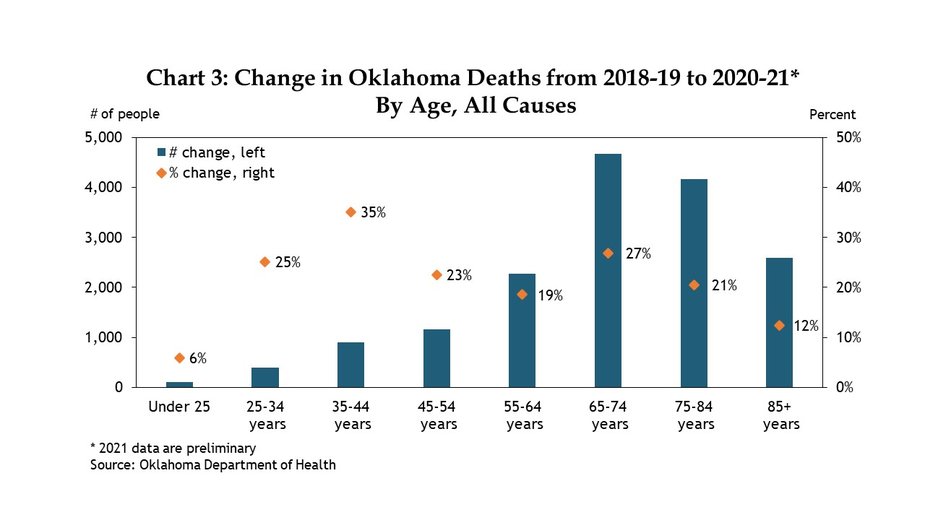
In addition, Oklahoma deaths jumped the most among people of color, rising 36% the past two years, compared with 16% for whites. The largest percentage increase was among Hispanic Oklahomans—53% more deaths in 2020 and 2021 than in 2018 and 2019. State deaths also rose 39% among American Indians, 37% among Asian Americans, and 28% among Black Oklahomans. Some recent studies have shown that this uneven distribution of illness, death and bereavement could continue to create disparate economic impacts moving forward._
A Surge of New Residents
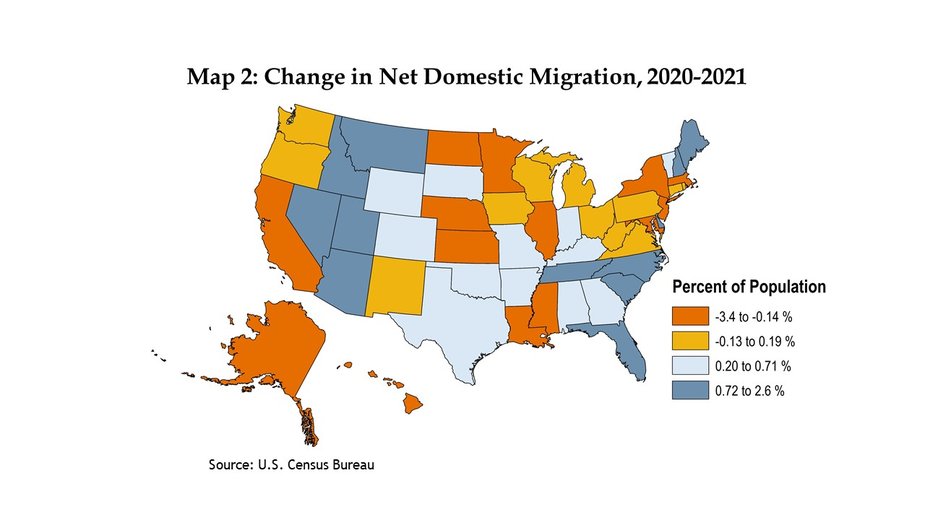
On a more positive note, Oklahoma’s gains in net domestic migration in 2021 were the highest since at least 1999. It was one of 16 states that added over half a percent to its population from this source last year and ranked 15th overall in net domestic migration (Map 2). According to the Census Bureau, almost 25,000 more people moved into Oklahoma than moved out from July 1, 2020, to July 1, 2021. This was about twice as many as in the previous year and continued an accelerating upward trend since 2019. It followed sizable outmigration from Oklahoma from 2016 to 2018, especially of college graduates, as detailed in two previous editions of The Oklahoma Economist._
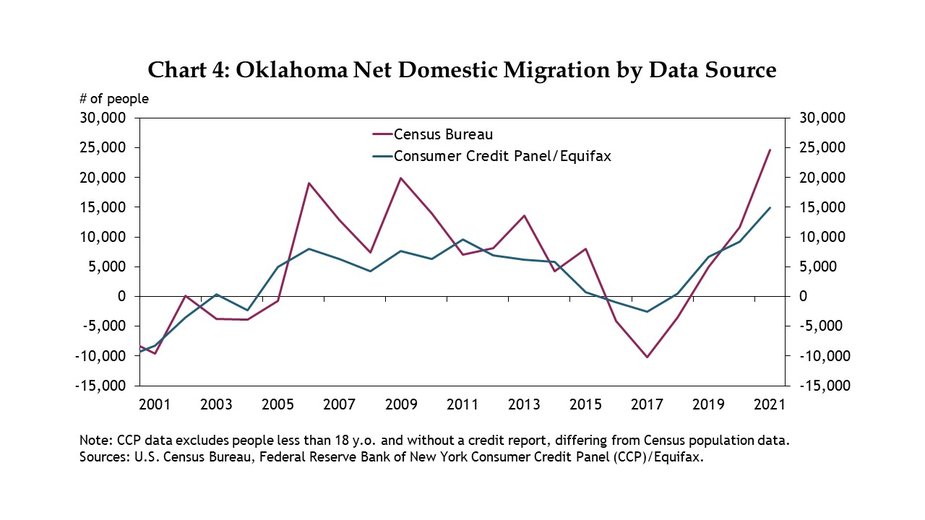
Another more timely and detailed resource for examining migration trends is the New York Fed’s Consumer Credit Panel (CCP)/Equifax data._ This database contains samples of anonymous credit reports where personal identification information such as Social Security numbers are redacted. The 5% sample contains millions of observations, including mortgage, loan and credit card data for adults who have applied for or received credit. This excludes people younger than 18 and consumers who do not have credit profiles, whereas Census surveys include all households regardless of age and credit usage. However, CCP/Equifax data is tabulated in subyear intervals and is released with a lag of just a few months, and the full 2021 calendar year information is now available. Census population estimates are only calculated on an annual basis from July to July and then released with a lag of six months, or even longer for more detailed data. The sample data from CCP/Equifax includes ZIP codes which can be used to track state-to-state migration flows closer to real-time than Census data. Overall, the directional migration trends of CCP/Equifax data match well with Census data and the differences can be attributed to the different populations sampled at different times of year (Chart 4).
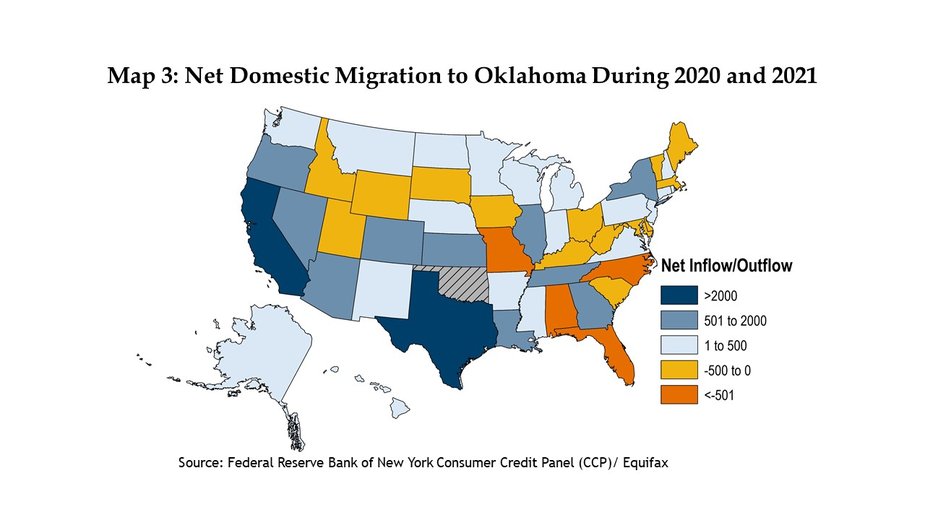
Based on CCP/Equifax data, during the pandemic calendar years of 2020 and 2021, Oklahoma gained more residents than it lost from 33 states (Map 3). In particular, people from California and Texas moved into Oklahoma at historic rates during 2020 and 2021: Oklahoma netted nearly 8,500 Californians and 7,300 Texans. By comparison, Oklahoma netted 1,500 and 1,100 new residents from Colorado and Arizona, respectively. Additionally, the increase in net domestic migration to Oklahoma intensified in the second half of 2021, a period not covered by the 2021 Census data.
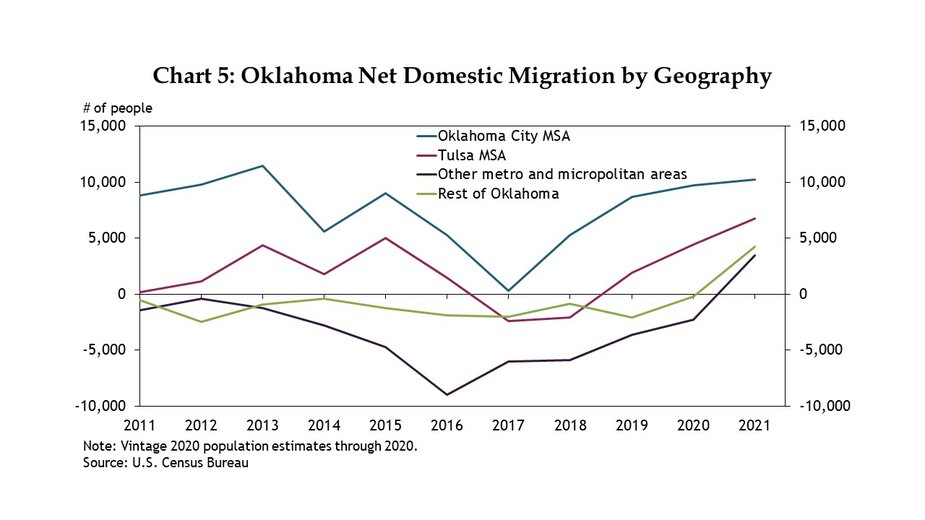
At a more granular geographic level afforded through Census data, domestic migration to Oklahoma increased for all sizes of places from July 1, 2020, to July 1, 2021 (Chart 5). The Oklahoma City and Tulsa metropolitan areas added about 10,000 and 7,000 people, respectively. In addition, smaller metropolitan and micropolitan areas, as well as rural areas, added thousands of people, reversing a decade-long outflow from those places. The smaller cities gaining the highest number of new residents from other places included Durant, Shawnee and Tahlequah. Along with nearly two-thirds of counties across the United States, 58 of Oklahoma’s 77 counties saw positive net domestic migration flows for 2021._ Additionally, 49 counties saw positive total population growth despite only 10 counties experiencing a natural increase in population (more births than deaths).
An End to the Brain Drain
Although Oklahoma’s most recent net outmigration of residents began in 2016 and ended in 2019, the state’s outmigration of college graduates began earlier—in 2013. While data on domestic migration by education level for 2021 are not yet available from the Census Bureau and are not tracked in the CCP, educational migration data through July 1, 2020—more than three months into the pandemic—can be analyzed for an early read on how the pandemic may have affected Oklahoma’s brain drain.
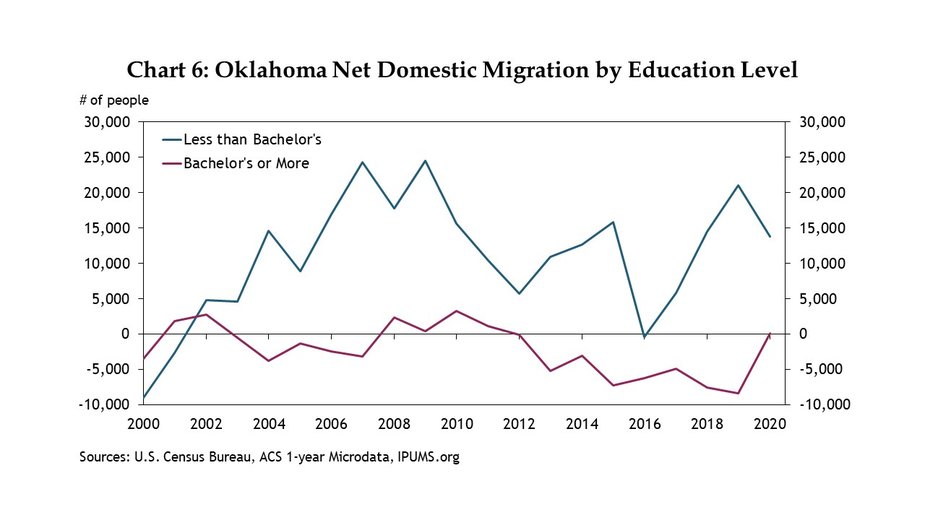
On net, college graduates stopped moving out of Oklahoma in 2020 following seven straight years of outflow—including the biggest outflows of all in 2018 and 2019 (Chart 6). While the end of Oklahoma’s brain drain in 2020 was a positive development, nearly all of the state’s overall net increase in new residents from other states in 2020 was still due to those with less than a bachelor’s degree. Of this group, though, the largest net inflow was of those with some college, including associate degrees, meaning Oklahoma did have a net gain in people with some post-high-school educational experience and training in 2020.
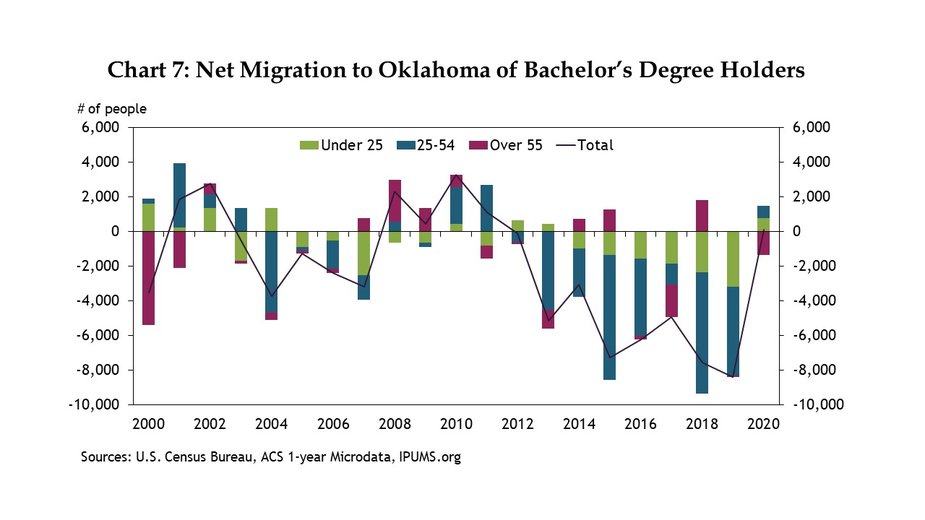
Moreover, slightly more college graduates of prime working age (25-54) moved into Oklahoma than moved out in 2020, the first time that has happened since 2012 (Chart 7). Younger college graduates (under 25) also showed a slight net inflow, while a net outflow of older college graduates (55+) roughly offset the state’s additions of highly educated workers in the two younger age groups in 2020. Retirements picked up during the pandemic, fewer retirees have returned to the workforce, and some may have moved out of state._
The state providing the most college graduates to Oklahoma in 2020, by far, was California, with an estimate of over 2,000. Oklahoma has had positive net inflows of college graduates from California before—including as recently as 2016—but the gains in 2020 were the highest since at least 2000. Oklahoma did, however, lose sizable numbers of college graduates to some other states, led by Florida, Virginia and Texas. The losses to Florida were easily the highest since 2000, while the losses to Texas—the destination for most of Oklahoma’s college graduates in recent years—were smaller than in four of the past five years.
Summary and conclusions
The last two years have witnessed historic shifts in the makeup of Oklahoma’s population. The pandemic inflicted the highest death rate in state history, across nearly all age groups. Oklahoma ranked in the top quarter of states in terms of COVID-related deaths, with deaths among people of color especially high. Conversely, thousands more people moved into Oklahoma during 2020 and 2021 than moved out, and the state ranked highly among states on this measure as well. Moreover, many communities across the state, of all sizes, saw positive in-migration, not just the two large metro areas. The state’s brain drain from 2013-19—when more bachelor’s degree holders moved out of the state than moved in—also ended in 2020. The net result of these demographic changes was the highest overall Oklahoma population growth in six years. However, with the sizable death rate and slowing international immigration, population gains still lagged the decade from 2005 to 2015. The components of population change have significantly shifted in Oklahoma over the past two years. It remains to be seen whether these trends will persist, and how the state’s economy will continue to evolve as a result.
Endnotes
-
1 Census Bureau annual population estimates are from July 1 of the previous year to July 1 of the reference year.
-
2 Data for 2021 are preliminary; final data are expected to be released in mid-2022.
-
3 External Linkhttps://covid.cdc.gov/covid-data-tracker/#cases_deathsper100k
-
4 External Linkhttps://pubmed.ncbi.nlm.nih.gov/28450441/
External Linkhttps://www.sciencedirect.com/science/article/pii/S2666518221000061 -
5 -
6 External Linkhttps://www.newyorkfed.org/research/staff_reports/sr479.html
External Linkhttps://www.kansascityfed.org/documents/8524/EconomicReviewV106N4BrownTousey.pdf
-
7 -
8 External Linkhttps://www.kansascityfed.org/documents/8240/eb21NieYang0811.pdf
The views expressed are those of the authors and do not necessarily reflect the positions of the Federal Reserve Bank of Kansas City or the Federal Reserve System.
Author