Growth in drilling activity in Oklahoma outpaced the U.S. in the first half of 2025, as natural gas prices rose from all-time lows even as oil prices fell. This edition of the Oklahoma Economist examines these trends and what may lie ahead. It finds the state’s oil and gas sector lagged other areas in the nation from 2019 to 2024 due to slower productivity growth and lower regional natural gas prices. Looking ahead, increasing natural gas takeaway and export capacity along with rising power demand could further boost natural gas prices and drilling activity.
Drilling activity has risen from all-time lows due, in part, to increasing natural gas prices
The number of active oil and gas rigs in Oklahoma has been on the rise for most of the past year, increasing from a low of 33 rigs in July 2024 to a peak of 55 this May (Chart 1, Panel A). In the same period, the rig count in the U.S. plateaued around 585. Much of the 67% increase in activity in the state can be explained by rising natural gas prices. Oklahoma produces a higher share of natural gas relative to oil than other drilling centers in the U.S. (Wilkerson and Farha 2023). Thus, drilling activity in the state is often correlated with volatile moves in natural gas spot prices, especially in recent years (Chart 1, Panel B).
Chart 1: Oklahoma’s rig count has increased from lows in mid-2024, driven by higher natural gas prices.
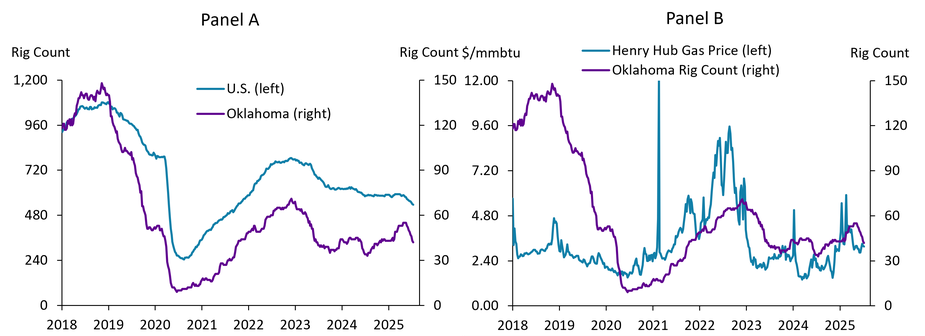
Sources: Baker Hughes, Energy Information Administration (Haver Analytics)
More specifically, moves in natural gas prices relative to oil prices can help explain trends in drilling activity. Oil prices remained mostly in the $60-$80 range in 2023 and 2024. During this time, production cuts in OPEC+ countries supported a floor for prices, while sluggish demand and relatively elevated supply from other countries capped prices (Kreil and Walsh 2025). As a result, prices in the U.S. stayed above the $64 price firms say is needed for profitability, but below the level firms need in order to substantially increase drilling, according to the External LinkKansas City Fed’s quarterly energy survey (Chart 2, Panel A). At the same time, natural gas prices fell to historic lows on an inflation-adjusted basis due to strong U.S. production, full storage, warm winter weather, and flat natural gas exports (Iraola 2025). Natural gas traded at or below the low $2 range during this period, well below the average profitable price of $3.49 in 2024, reducing margins for gas-heavy plays in Oklahoma (Chart 2, Panel B).
Chart 2: Natural gas prices have been volatile but are poised for increase, while oil prices have been rangebound.
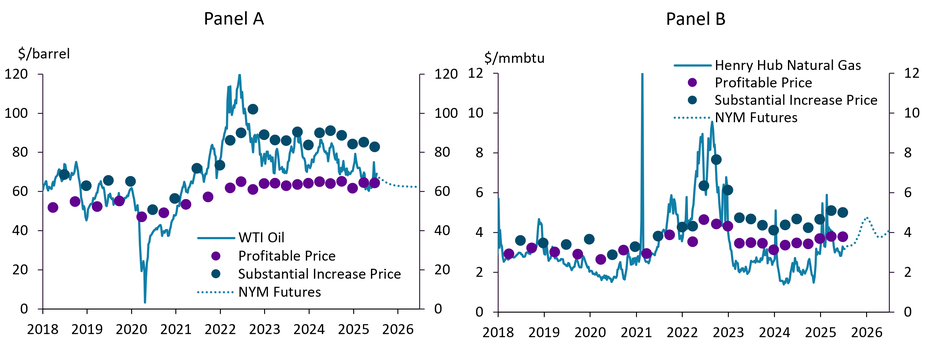
Sources: Energy Information Administration (Haver Analytics), Federal Reserve Bank of Kansas City, New York Mercantile Exchange (Yahoo Finance)
The oil-to-natural gas price ratio has deviated from its long-run average in recent years, impacting Oklahoma’s drilling activity. The price ratio has fluctuated around a value of 20 for the past decade, as oil and gas prices largely moved in parallel. But the ratio moved from its average in recent years as the prices became more bifurcated. Since 2022, Oklahoma’s rig count has been inversely correlated with movements in the oil-to-gas price ratio. When the Russia-Ukraine War began in 2022, the ratio fell from 20 to 10, and Oklahoma’s rig count climbed from 50 to 69 as natural gas prices rose due to elevated European demand for U.S. natural gas (Chart 3). Then, natural gas prices fell and oil prices remained rangebound, driving the ratio to surpass 30 in 2023 and peak at 53 in March 2024. At the same time, the rig count in gas-heavy Oklahoma fell as low as 33.
Chart 3: Natural gas prices increased relative to oil in H1 2025, boosting activity in Oklahoma.
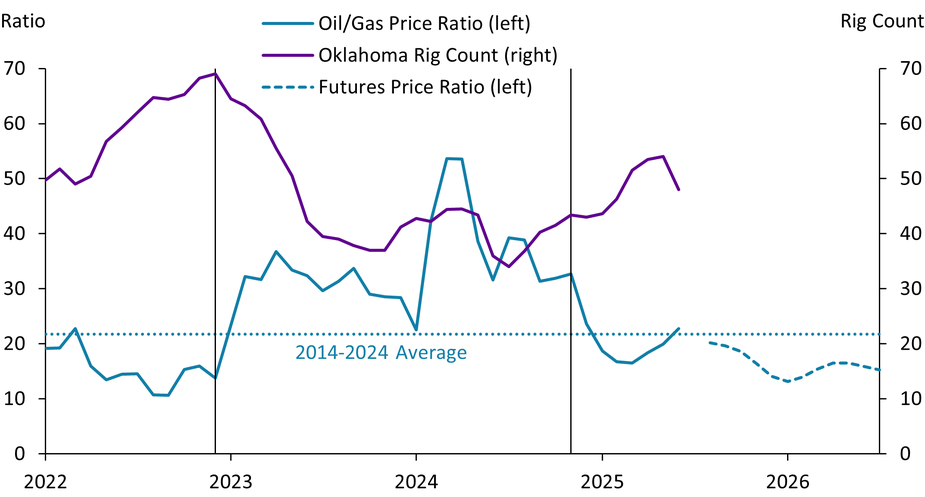
Sources: Energy Information Administration (Haver Analytics), Baker Hughes, New York Mercantile Exchange (Yahoo Finance), authors’ calculations
In 2025, increases in natural gas prices relative to oil prices have bolstered drilling in Oklahoma. This year, oil prices fell due to slowing global demand and OPEC+ supply increases, while natural gas prices rose to profitable levels due to increased liquified natural gas (LNG) exports outpacing supply (EIA 2025). Consequently, the oil-to-gas price ratio returned near its long-run average and Oklahoma’s rig count has risen since late 2024. More recently, natural gas prices have been below their breakeven for profitability, and oil prices have fluctuated around their breakeven since April, causing rigs to decline in June in both Oklahoma and the U.S. However, futures markets expect natural gas prices to continue increasing relative to oil, indicating potential for further increases in drilling in Oklahoma (Chart 3). The rest of this article provides some historical perspective on natural gas production in the region and examines the primary factors which have contributed to a more bullish outlook for natural gas and its broader implications for the state’s economy.
Growth in the Permian Basin and lack of takeaway capacity has led to low regional prices for producers, but that may change in coming years
The Permian Basin in West Texas and Eastern New Mexico accounted for a major share of U.S. oil production in recent years. Beginning around 2011, technological advancements in horizontal drilling and hydraulic fracturing enabled commercial drilling of tight oil in select U.S. oil fields, particularly the Bakken in North Dakota and Eagle Ford in Texas, driving nearly all growth in total domestic oil production (Çakır Melek 2015). However, production growth in the Permian Basin far outpaced any other formation starting in 2018. By 2020, the Permian produced as much tight oil as all other formations in the U.S. and has accounted for nearly all domestic production growth since (Chart 4).
Chart 4: The Permian Basin now accounts for a majority U.S. tight oil production.
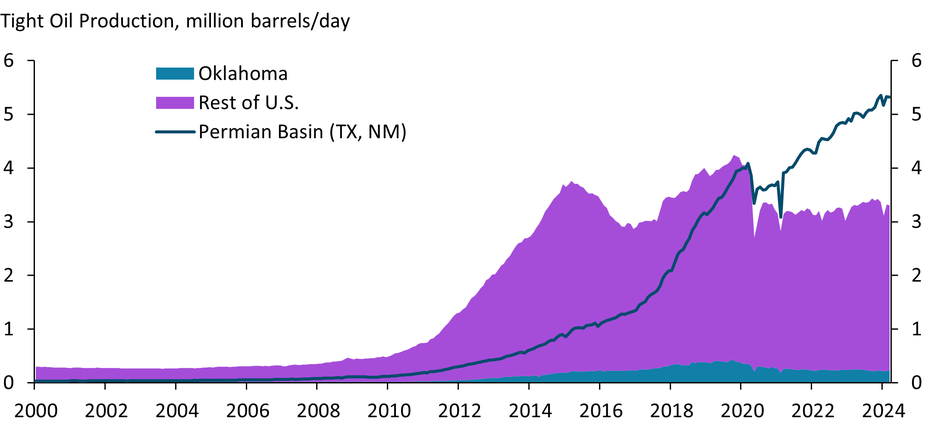
Note: Oklahoma tight oil production aggregates the Mississippian and Woodford formations. Permian Basin aggregates the Bonespring, Spraberry, and Wolfcamp formations.
Sources: Energy Information Administration (Haver Analytics)
In addition, growth in oil-well productivity in the Permian outpaced productivity gains in Oklahoma’s Anadarko Basin. The collapse in oil prices in 2014 accelerated drilling productivity in the U.S. When prices are in decline, producers are incentivized to concentrate on drilling in only the most productive regions (Brown and others 2019). As a result, the Permian Basin’s productivity doubled from 3 barrels of oil per foot of depth in 2014 to 6 barrels in 2016, while other formations lagged around 4 barrels per foot (Chart 5, Panel A). By 2023, drilling in the Permian yielded 8 barrels of oil per foot while the Anadarko in Oklahoma still only yielded 4 barrels. Although the oil-heavy Permian produces far less gas per foot drilled, the Anadarko’s gas productivity still lagged other basins in the Lower 48 on average by 3 equivalent barrels per foot in 2023 (Chart 5, Panel B). Thus, Oklahoma does not have a distinct productivity advantage. Lower productivity causes higher operating costs for producers, lowering the potential returns of drilling in Oklahoma relative to other areas.
Chart 5: Productivity in other plays has outpaced productivity gains in Oklahoma's Anadarko Basin
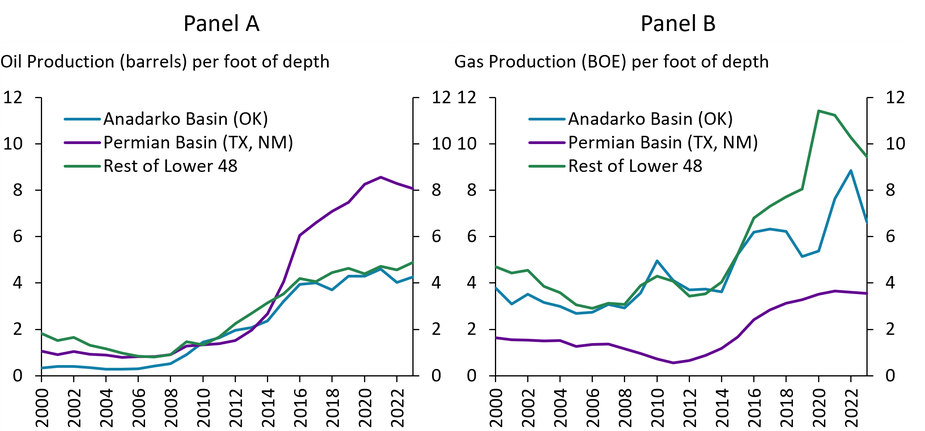
Notes: The productivity metric developed by Brown and others (2019) calculates the volume of oil or gas produced by new wells in the first 12 months divided by the total vertical and horizontal depth of the wells. Gas production is measured in barrels of oil equivalent (BOE), where 6 thousand cubic feet (MCF) = 1 BOE.
Sources: Enverus, Brown and others (2019), authors’ calculations
Oklahoma’s lower productivity, along with other factors, caused growth in the state’s oil and gas sector to lag other parts of the country. Oklahoma’s share of total U.S. oil and gas production and employment remained steady from 2000 to 2018 around 6-7% and 9-10%, respectively (Chart 6). The state’s share of the sector’s rigs and GDP were more volatile but increased consistently from 2012 to 2018. Oklahoma’s oil and gas footprint consistently started falling in 2019 as the Permian’s share of activity rose, with the state comprising only 5% of production and 7-8% of rigs, GDP, and employment as of their most recent readings. Low natural gas prices, the state’s lower drilling productivity, and its higher share of office workers in the sector susceptible to losing jobs due to consolidation all contributed to these declines (Wilkerson and Farha 2023).
Chart 6: Oklahoma’s share of the U.S. oil and gas sector has fallen since 2018.
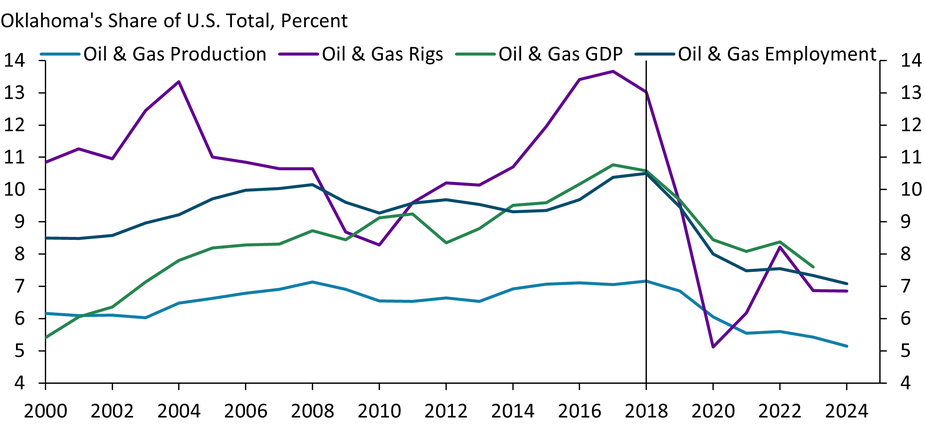
Notes: Oil & Gas production is measured as the sum of oil production measured in barrels and gas production measured in barrels of oil equivalent (BOE), where 6 thousand cubic feet (MCF) = 1 BOE. Oil & Gas GDP and employment include Oil & Gas Extraction (NAICS 211) and Support Activities for Mining (NAICS 213).
Sources: Energy Information Administration, Baker Hughes, Bureau of Economic Analysis, Bureau of Labor Statistics (Haver Analytics), authors’ calculations
The Permian Basin’s vast production growth has partially contributed to lower natural gas prices for Oklahoma operators in recent years. When drilling for oil, natural gas is also produced as a byproduct. So, associated natural gas from shale formations like the Permian increased as technological advances allowed for commercial-scale shale oil production. Volumes of associated gas produced in the Permian increased eight-fold from 2014 to 2024 as the basin’s oil production increased and its wells produced more gas relative to oil over time (Manning-Pickett 2024). However, the amount of natural gas from the Permian that reached the market only increased five-fold in this time from 5 to 25 billion cubic feet per day (BCF/day) (Chart 7, Panel A). This is because gas withdrawals in the Permian outgrew the pipeline capacity required to deliver gas to other markets, forcing producers to flare, reinject or store excess gas. Oversupply alongside constrained pipeline capacity can lower prices broadly and contributed to a divergence between the spot price at the Waha Hub—the primary natural gas trading hub in the Permian—and the Henry Hub, the national benchmark hub in Louisiana, beginning in 2018 (Chart 7, Panel B). The Waha price even traded at a negative value for nearly half of the weeks in 2024, meaning that producers paid buyers to take the gas.
Chart 7: Natural gas prices at the Waha Hub have diverged from the national benchmark as takeaway capacity has lagged production.
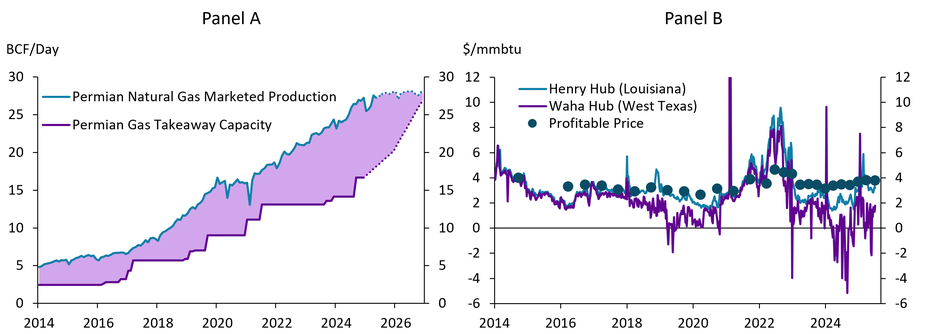
Note: Blue dotted line in Panel A shows the EIA’s forecast. Purple dotted line shows planned pipeline capacity increases by the end of 2025 and 2026.
Sources: Energy Information Administration (Haver Analytics), Bloomberg, Federal Reserve Bank of Kansas City, authors’ calculations
Low prices at the Waha Hub can negatively impact Oklahoma producers and natural gas prices more broadly, but are likely to increase in the future. Oklahoma exploration and production firms that operate in the Permian take the Waha price, but even operators who do not can also be impacted if they transport natural gas through the hub or if they trade financial contracts that are settled at Waha. Additionally, because regional pipeline systems are interconnected, deep discounts at Waha can put downward pressure in nearby basins like the Anadarko, even if its gas isn’t directly sold through the hub. Looking ahead, oil and gas production growth in the Permian is forecast to slow, while additional pipelines are planned to deliver gas out of the basin to the Houston area and to LNG export terminals by 2026 (Chart 7, Panel A; Fleury and Munoz-Cortijo 2024)_. If pipeline capacity additions outpace production growth as projected, prices at the Waha Hub are likely to rise in the coming years, potentially boosting overall prices and drilling for natural gas.
Demand for natural gas is likely to increase due to rising LNG export capacity and electricity consumption
In addition to increasing deliveries to LNG export terminals, total U.S. LNG export capacity overseas is set to increase in the coming years, boosting the outlook for domestic natural gas production. As the construction of LNG terminals in the Gulf Coast added capacity to ship LNG overseas, U.S. LNG exports increased markedly from 0 BCF/day at the start of 2016 to 15 BCF/day by April 2025 (Chart 8). Exports to Europe surged in 2022 at the onset of the Russia-Ukraine War, lowering exports to Asia due to capacity constraints. Additional export terminals are planned to come online in the next 4 years to fill still-rising international demand from Europe and Asia, with export capacity anticipated at 25 billion cubic feet per day by the end of 2028, nearly a 50% increase from current capacity. Increased ability to ship LNG to demand centers overseas will likely heighten demand for domestic natural gas production, potentially raising prices and drilling activity in gas-heavy Oklahoma.
Chart 8: Liquified natural gas (LNG) export capacity is set to increase.
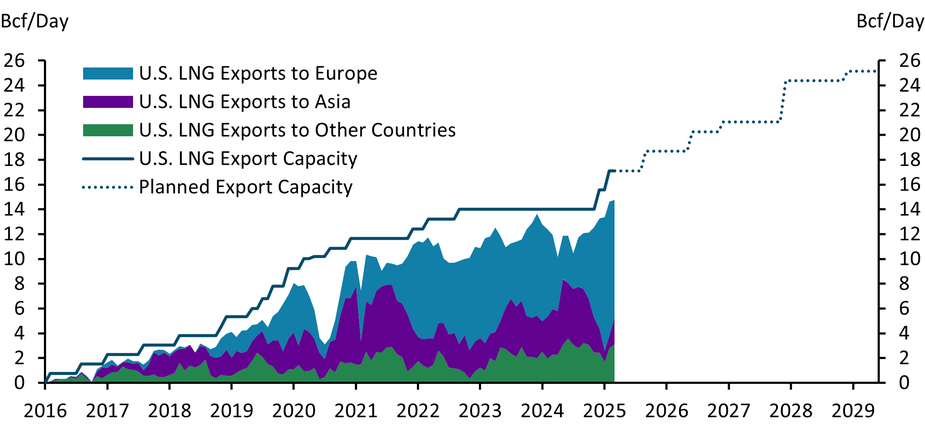
Sources: Energy Information Administration (Haver Analytics), authors’ calculations
Domestic natural gas is also well-positioned to help meet rising electricity demand in the future. Power demand in the U.S. was essentially flat from 2005 to 2020 as technological efficiencies offset growth from the broader economy (Chart 9, Panel A). Power demand is set to increase at an average annual rate of 1.8% from 2020 to 2026, driven by electricity-intensive commercial and industrial activity (Schipper and Hodge 2025). Commercial electricity demand accounted for 60% of growth in total U.S. power demand during 2021-23, with data centers and AI adoption serving as key drivers (Çakır Melek and Gallin 2024).
Chart 9: Natural gas is positioned to help meet the nation’s rising electricity demand.
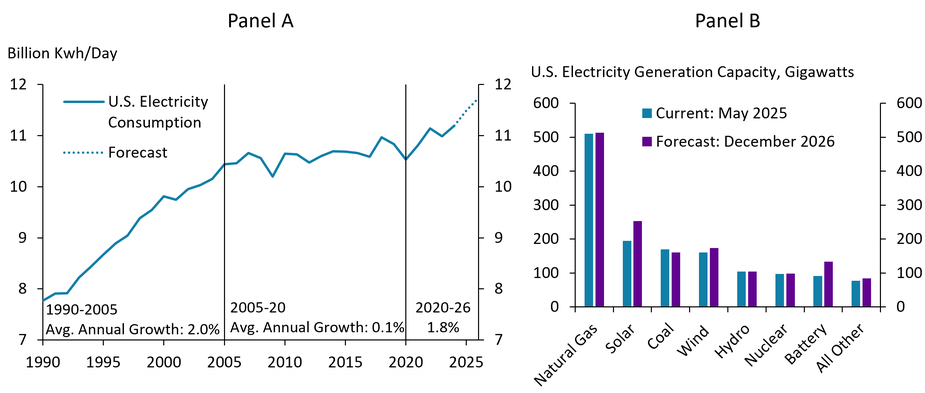
Sources: Energy Information Administration (Haver Analytics), Schipper & Hodge (2025)
Natural gas is the largest source of power generation in the U.S. and Oklahoma, accounting for 43.1% of the nation’s electricity generation in 2023 (Buttel 2025), and has the most installed generating capacity by a large margin at 42.7% of total capacity (Chart 9, Panel B). Other renewable sources—such as solar, wind, and battery storage—are set to increase at a faster pace in the coming years and may compete with gas on cost as natural gas prices are set to rise (EIA 2025). However, natural gas remains a reliable complement to these sources and offers flexible and scalable generation capacity.
How would increased drilling activity impact the state’s broader economy? The oil and gas sector represents a much greater share of total economic activity in Oklahoma than almost any other state. Oil and gas accounted for around 1% of total U.S. GDP in 2024, while it made up 8% in Oklahoma. Further, the sector contributed 18% of total state tax revenues as of 2023, an even higher share than in the 1990s, keeping it important for state policymakers (Chart 10). By contrast, the oil and gas sector does not directly employ many people in the state, making up only 1.7% of employment in 2024, but other jobs may be indirectly affected. Technological advances mentioned above have allowed the industry to increase oil and gas production with less employees and investment, indicating that employment in the sector is unlikely to increase substantially (Wilkerson and Shupert 2021). Increased drilling activity from higher natural gas prices could increase the state’s tax revenue collection and GDP, but would likely have a muted effect on employment.
Chart 10: The oil and gas sector still contributes to sizable shares of Oklahoma’s tax revenues and GDP.
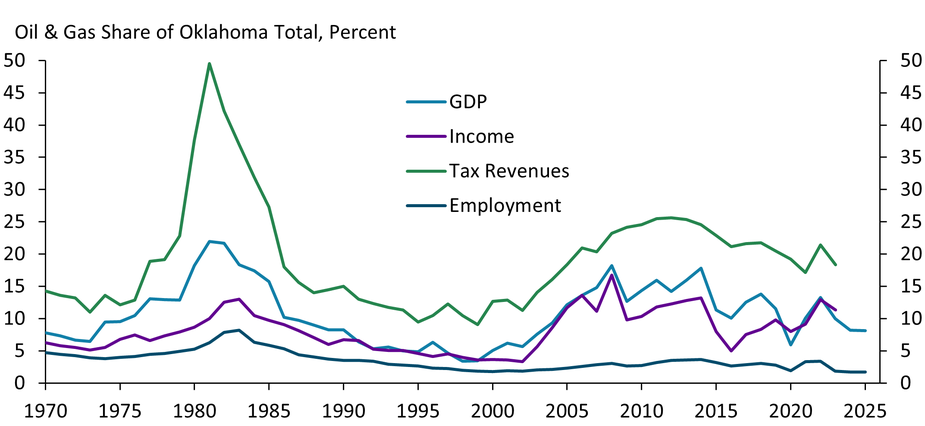
Note: 2025 data go through Q1 for GDP and May for employment.
Sources: Bureau of Economic Analysis, Bureau of Labor Statistics (Haver Analytics), authors’ calculations
Summary and Conclusions
Oklahoma’s oil and gas sector weathered a turbulent decade. Increased volumes of associated gas from the Permian Basin and other shale formations contributed to a sustained oversupply, driving down gas prices relative to oil and dampening drilling in gas-heavy basins in Oklahoma. Consequently, the state’s active rig count has closely followed volatile natural gas prices, and regional prices in West Texas fell below the national benchmark.
In 2025, oil prices fell, and natural gas prices rose amid growing LNG export capacity, supporting a rebound in Oklahoma drilling. Although natural gas prices have eased in recent weeks, the overall upward trend is expected to continue as takeaway constraints in the Permian ease and export capacity expands further. Additionally, natural gas is well-positioned as a reliable and scalable source of electricity generation to meet rising power demand from AI and data centers, supporting its long-run role in the U.S. energy mix. Any further increase in drilling activity is unlikely to impact the state’s employment but would likely boost tax revenues and GDP. Heading forward, the state’s natural gas outlook appears increasingly bullish, if infrastructure keeps pace with demand.
The views expressed are those of the authors and do not necessarily reflect the positions of the Federal Reserve Bank of Kansas City or the Federal Reserve System. The authors are grateful for helpful discussions with Megan Williams, Nida Çakır Melek, David Rodziewicz, and Jason Garner and their insightful advice on this article.
Endnotes
-
1 Current Permian takeaway capacity includes the following pipelines: El Paso, Permian Highway, Permian North, Comanche Trail, Roadrunner, Gulf Coast Express, Whistler, Trans-Pecos, Malaga Lateral, Transwestern, and Matterhorn. Planned additions include the Apex, Blackfin, Saguaro Connector, Hugh Brinson, and Gulf Coast Express Expansion pipelines.
References
Brown, Jason, David Rodziewicz, and Colton Tousey. 2019. “Drilling Productivity in the United States: What Lies Beneath.” Federal Reserve Bank of Kansas City, Economic Bulletin, May 22.
Buttel, Lindsey. 2025. External LinkAmerica’s Electricity Generation Capacity: 2025 Update. American Public Power Association.
Çakır Melek, Nida. 2015. “External LinkWhat Could Lower Prices Mean for U.S. Oil Production?” Federal Reserve Bank of Kansas City, Economic Review, vol. 100, no. 1, pp. 51–69.
Çakır Melek, Nida and Alex Gallin. 2024. “Powering Up: The Surging Demand for Electricity.” Federal Reserve Bank of Kansas City, Economic Bulletin, September 25.
Fleury, Katy and Laia Munoz-Cortijo. 2024. “External LinkNatural gas pipeline capacity from the Permian Basin is set to increase.” U.S. Energy Information Administration, Today in Energy.
Iraola, Andrew. 2025. “External LinkSpot Henry Hub natural gas prices hit a historic low in 2024.” U.S. Energy Information Administration, Today in Energy.
Kreil, Erik and William Walsh. 2025. “External LinkA look back at our forecast for global crude oil prices in 2024.” U.S. Energy Information Administration, Today in Energy.
Manning-Pickett, Trinity. 2024. “External LinkShare of natural gas production in U.S. tight oil plays increased over the last decade.” U.S. Energy Information Administration, Today in Energy.
Schipper, Mark and Tyler Hodge. 2025. “External LinkAfter more than a decade of little change, U.S. electricity consumption is rising again.” U.S. Energy Information Administration, Today in Energy.
U.S. Energy Information Administration (EIA). 2025. External LinkShort-Term Energy Outlook (STEO) June 2025. U.S. Energy Information Administration.
Wilkerson, Chad and Chase Farha. 2023. “Outsized Decline: Oklahoma’s Energy Employment since 2019.” Federal Reserve Bank of Kansas City, Oklahoma Economist, October 19.
Wilkerson, Chad and Courtney Shupert. 2021. “Oklahoma’s Evolving Energy Landscape.” Federal Reserve Bank of Kansas City, Oklahoma Economist, December 17.
The views expressed are those of the authors and do not necessarily reflect the positions of the Federal Reserve Bank of Kansas City or the Federal Reserve System.
Authors

Cortney Cowley
Assistant Vice President and Oklahoma City Branch Executive