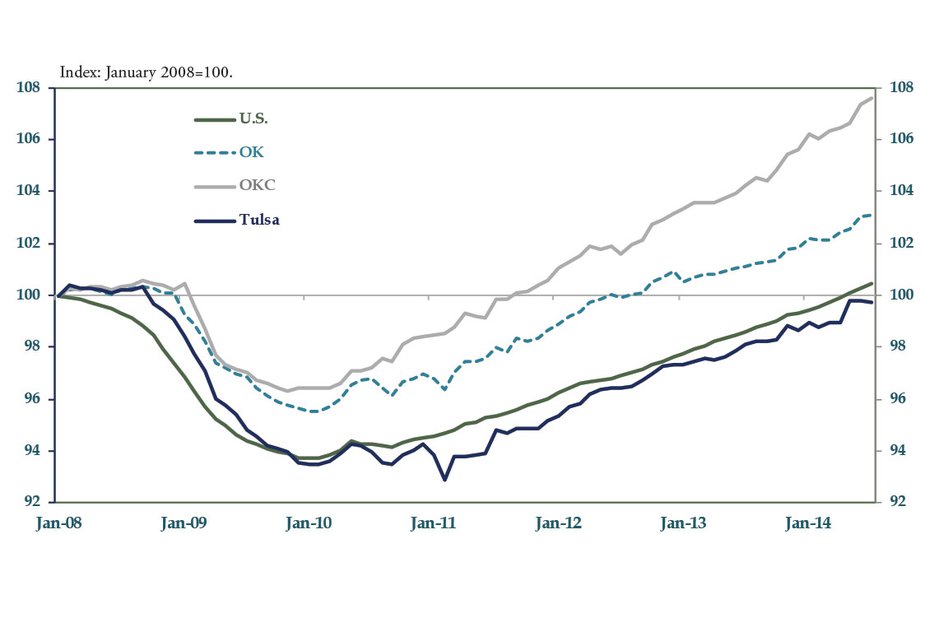
Economic growth in Oklahoma continued its solid pace over the summer. Oklahoma payroll employment was up 1.8 percent, or more than 30,000 jobs, from a year ago in July—higher than the 1.2 percent growth in July 2013 (Chart 1). National payroll employment grew at a similar pace of 1.9 percent. The Oklahoma City metro leads job growth in the state, with employment more than 7 percent higher than before the recession. The Tulsa metro also added more than 7,000 jobs year-over-year. As of July, leisure and hospitality jobs grew at the fastest rate in the state, adding close to 9,000 jobs since last year. Manufacturing, education and health services, and financial activities also showed solid growth. In contrast, information and professional and business services jobs slowed modestly over the past year.
Chart 1: Payroll Employment Growth Through July 2014; Seasonally Adjusted
The state’s unemployment rate remained basically unchanged at 4.6 percent in July, while county unemployment rates varied across the state in June. The jobless rates in the Oklahoma City and Tulsa metro areas rose slightly to 4.7 percent and 4.9 percent, respectively, in June (the latest data available). Unemployment remains exceptionally low in northwest Oklahoma and in south-central Oklahoma and only exceeds the national average in some eastern and southeastern parts of the state.
Update provided by External LinkMegan Williams, associate economist and manager, and External LinkElena Ojeda, research associate, at the Federal Reserve Bank of Kansas City, Oklahoma City Branch.
Spotlight On: Oklahoma's Trade - Exports
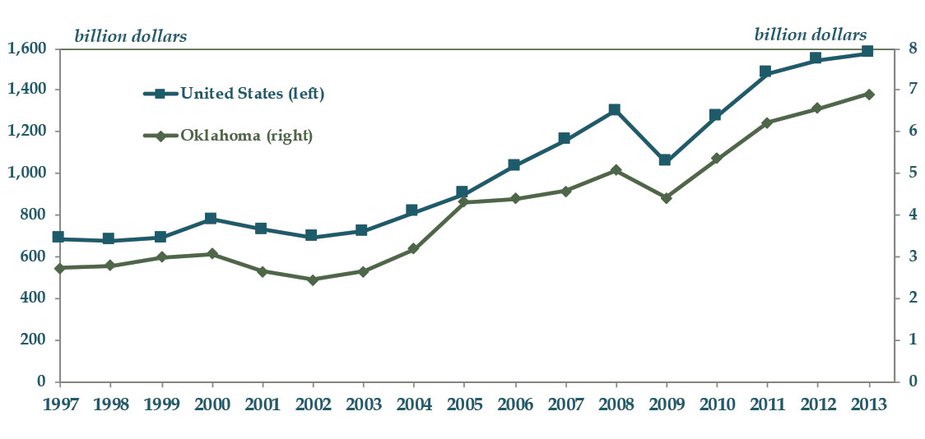
In 2013, Oklahoma’s exports totaled $6.9 billion, 5.1 percent higher than 2012 and more than double from a decade ago (Chart 2). Furthermore, exports accounted for almost 3.8 percent of Oklahoma’s gross domestic product in 2013. Oklahoma’s export growth mirrors a comparable trend in the nation. In comparison to other states, Oklahoma ranked 37th in exports for both 2012 and 2013, down one spot from 2010 and 2011.
Chart 2- Oklahoma vs. US Exports
Year-to-date through June 2014, state exports equaled $3.26 billion, 8.4 percent lower than in the same period last year. The slowdown can be attributed to a sizeable drop of exports in early 2014, likely due to inclement weather that disrupted economic activity across much of the nation. State exports contracted 30 percent in January month-over-month, but recovered in the following months and increased 6.6 percent in February and 17 percent in March.
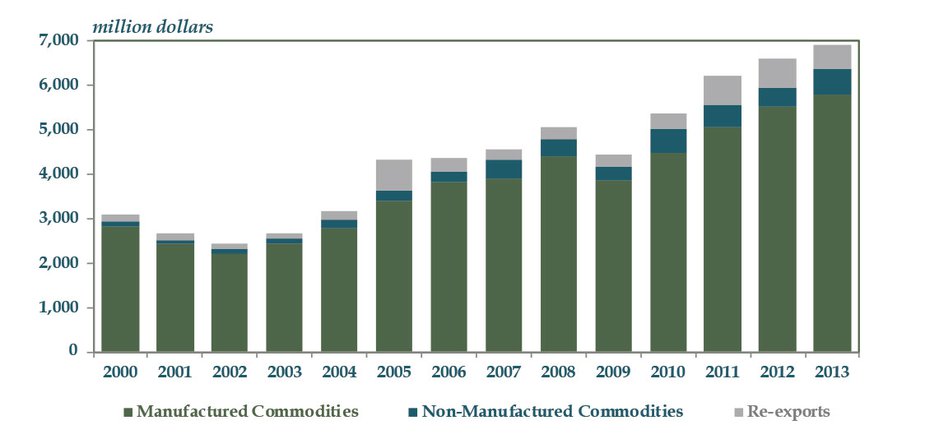
The U.S. Census Bureau classifies export goods into three categories: manufactured, nonmanufactured, and re-exports. Manufactured products make up more than 80 percent of state exports, the largest share but a lower percentage than in the early 2000s (Chart 3). Nonmanufactured product exports, while only accounting for a small share, have grown over the past decade (see description below). Re-exports is similar in share size to non-manufactured products. The category is defined by the Census Bureau as exports of foreign merchandise that have not been changed in form or condition since entering the United States.
Chart 3: Oklahoma Export Commodities
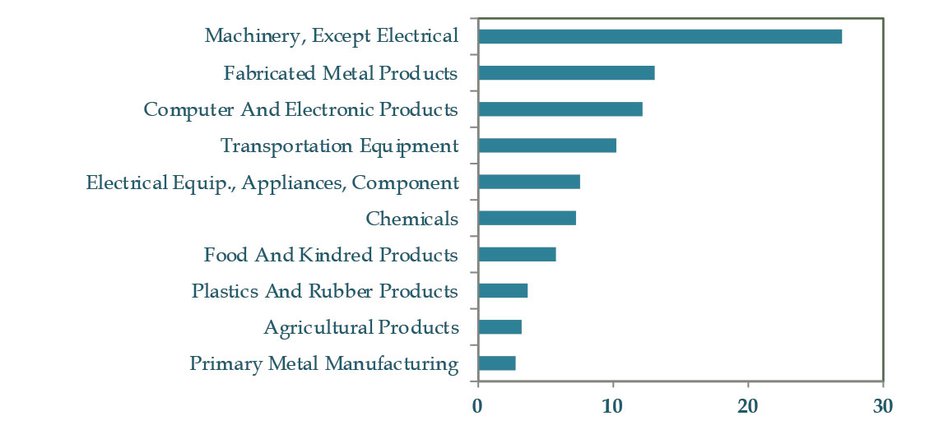
Oklahoma’s top manufactured export is machinery (except electrical), which alone accounted for close to 27 percent ($853 million) of total exports year-to-date (Chart 4). Machinery has been the number one export since 1997, except for the years 1999 and 2005, when transportation equipment took the top spot. Other year-to-date top manufactured exports include fabricated metal products ($413 million) and computer and electronics ($387 million).
The nonmanufactured category includes agriculture, forestry, fishery products, mineral commodities, scrap, waste and used merchandise. Agricultural products are the primary export goods in this category and make up 3.3 percent ($104 million) of total state exports year-to-date. As of June, Germany has been the top market for agricultural products from Oklahoma, followed by Mexico and China.
Chart 4: Oklahoma Top 10 Exports Percent of Total, Year-to-Date Data Through June 2014
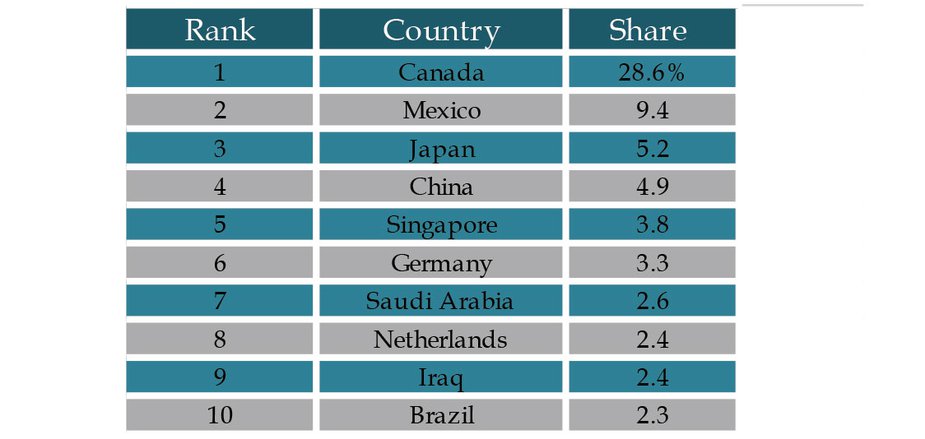
Goods produced in the state are exported to numerous countries across the world (Table 1). Since collection of state level data began in 1995, Canada has been the top export market for Oklahoma. As of June, it accounts for approximately 29 percent ($907 million) of state exports. The top two exports to Canada so far this year have been machinery, except electrical, and fabricated metal products. The second top export market is Mexico, and it accounts for about 10 percent ($298 million) of state exports. Fabricated metal products and food products are the top two state exports to Mexico year-to-date. Other top export markets for the state include Japan ($166 million), China ($154 million) and Singapore ($119 million). The corresponding number one export for each country is computer and electronic products, food products, and machinery, respectively.
Table 1: Oklahoma Top Export Markets
Ask an Economist: How Much Stock Market Wealth do Oklahomans Have?
State data on stock market wealth do not exist. However, one method economists have used to estimate such wealth is to multiply a state’s share of U.S. dividend income (from U.S. Bureau of Economic Analysis data) by the total amount of corporate equities, mutual funds and retirement plans held by Americans (from Federal Reserve Board data).
Estimates based on this method show that for the past five years, Oklahomans have held as much or more stock market wealth as the national average (Chart 5). In 2013, this amounted to about $125,000 per person (assuming Oklahoma’s share of U.S. dividend income in 2013, for which no data are available, stayed the same as in 2012). But prior to 2009, Oklahoma had always lagged the nation in stock market wealth, often by sizable amounts. As recently as 2005 and 2006, on the eve of the recent financial crisis, per capita stock market wealth in the state was about 90 percent of the national average. And during most of the 1990s, when the stock market was booming, Oklahomans’ equity wealth was about 70 percent of the U.S. average.
Chart 5: Real Per Capita Stock Market Wealth, 1975-2013
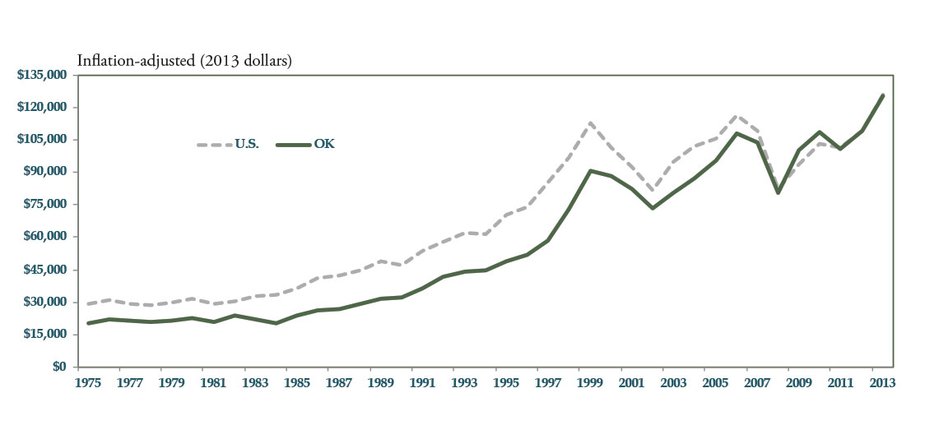
A lack of data prevents analysis of the causes of Oklahoma’s “catching up” in stock market wealth. However, strong overall growth in the state’s economy for the past decade has likely helped. In addition, Oklahomans may hold more oil and gas stocks, which have performed especially well, than average due in part to employee stock options at Oklahoma-based energy companies.
The views expressed are those of the authors and do not necessarily reflect the positions of the Federal Reserve Bank of Kansas City or the Federal Reserve System.
Author