Oklahoma’s economy staged a solid recovery in 2017. State GDP and employment rose after dropping in 2015 and 2016, while unemployment fell. The state’s important energy sector led the initial stages of the recovery, but by midyear most other sectors also were improving. Even Oklahoma’s agriculture industry, which suffered along with other commodity sectors in 2015 and 2016, showed signs of stabilizing in the second half of 2017. With oil at a price where the energy industry says it can be profitable and overall conditions better in most industries, the outlook for the state’s economy in 2018 appears positive.
Energy drives rebound from recession in state GDP
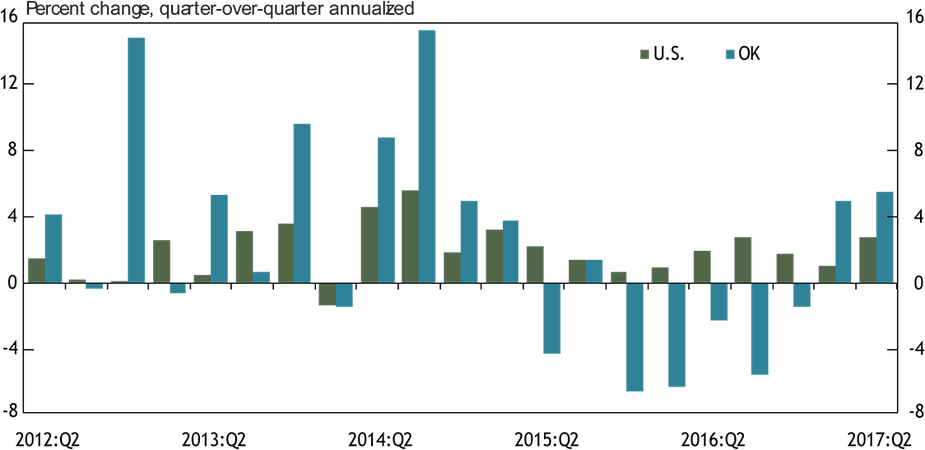
Real gross domestic product (GDP) in Oklahoma rose solidly in the first two quarters of 2017 after dropping in six of the previous seven quarters (Chart 1)._
Chart 1. Real Gross Domestic Product
Source: BEA
Many of the quarterly declines in output in 2015-16 were sizable, as real GDP fell more than 4 percent on an annualized basis in four of the six declining quarters. One common definition of a recession is two consecutive quarters of declining real GDP. Based on this definition and on other more complex measures, Oklahoma’s economy was in a recession for much of 2015 and 2016._
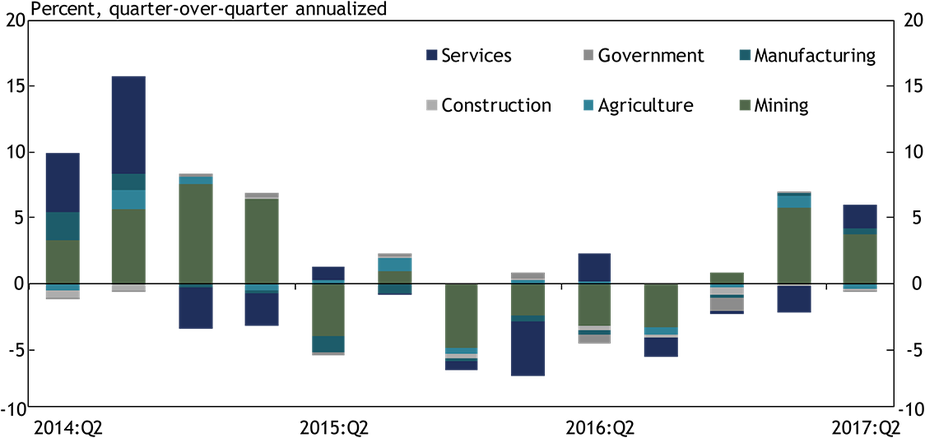
The main contributing industry to the sizable declines in Oklahoma real GDP in 2015 and 2016 was the mining sector (Chart 2).
Chart 2. Contributions to Percent Change in Oklahoma Real GDP
Source: BEA
In Oklahoma, that sector consists almost completely of oil and gas activity. Indeed, more than half of the decline in Oklahoma real GDP in 2015-16 can be attributed directly to the oil and gas industry. However, by the end of 2015, all major economic sectors in Oklahoma were contributing to the decline, and most continued to deteriorate through the third quarter of 2016.
In late 2016, as oil prices rose, the mining sector began to add positively to GDP growth, although not enough to lift overall economic growth in the state into positive territory. Then in the first two quarters of 2017, mining added significantly to state economic growth, pushing overall state output growth to about 5 percent in both quarters, on an annualized basis. Perhaps even more encouragingly, by the second quarter of this year—the last period for which state GDP data are available—no major sector of the state’s economy was producing more than a very slight negative drag to GDP, and most were expanding.
Broad-based employment improvement by late 2017
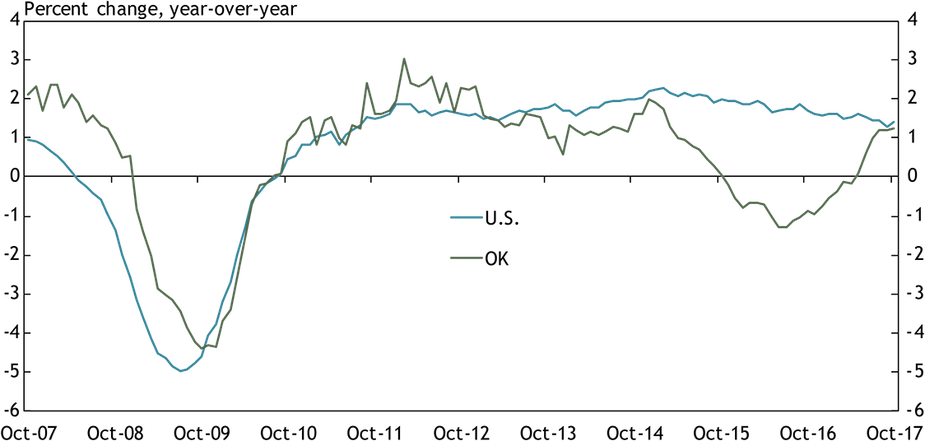
As the recovery in state GDP took hold in early 2017, growth in jobs soon followed. Employment in the state moved above year-ago levels in May, after falling for a year and a half. By August, job growth in the state had nearly reached the national rate, and stayed there in September and October (Chart 3).
Chart 3. Payroll Employment Growth
Source: BLS
The latest data show that employment in the state is now 1.2 percent higher than a year ago.
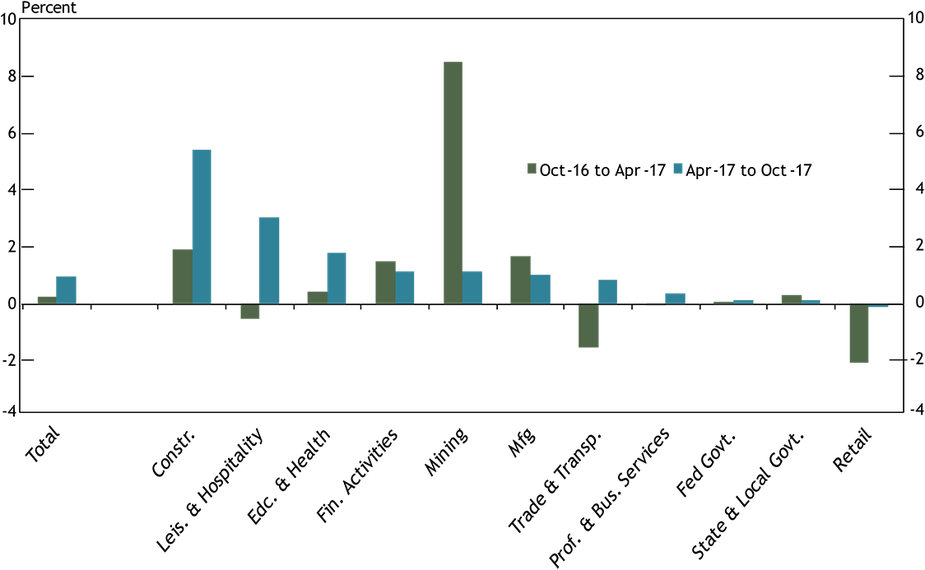
Job gains have not been evenly distributed across industries over the past year, but since spring all industries have at least held steady in terms of employment. From October 2016 to April 2017, overall employment in the state rose just 0.2 percent, as strong gains in mining, construction, manufacturing and finance jobs were largely offset by declines in retail, transportation and leisure and hospitality (Chart 4).
Chart 4. Oklahoma Employment Growth by Industry
Source: BLS
But since April, total employment has risen nearly 1 percent, with virtually all industries adding jobs.
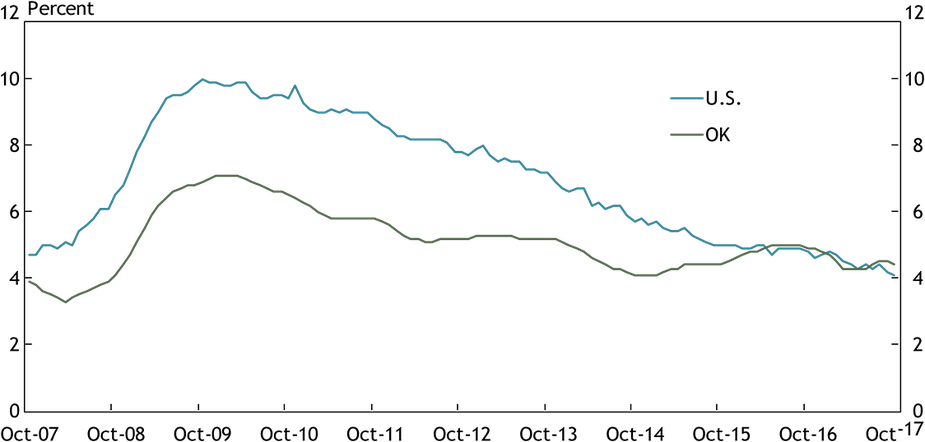
The employment growth in the state in 2017 has helped bring unemployment back down. Oklahoma’s unemployment rate rose to 5 percent in mid-2016, after falling as low as 4.1 percent in late 2014.
Chart 5. Unemployment Rate
Source: BLS
But since this February, the rate has been at or below 4.5 percent, closely mirroring the national rate. As labor markets in the state tightened again and higher-paying jobs returned, wages also began rising, as noted in the second quarter Oklahoma Economist.
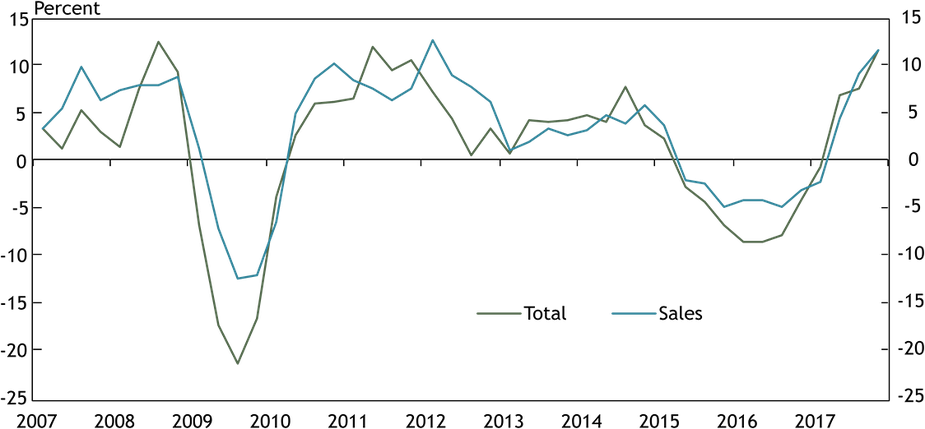
As the state’s energy and other sectors recovered and more people returned to work in higher-paying industries, the state government’s finances began to improve. Overall state tax revenues fell sharply in 2015 and 2016, to nearly 10 percent below previous-year levels at times, and sales taxes were down nearly 5 percent. These declines have and continue to put considerable pressure on the state budget. But since early 2017, government tax receipts have risen steadily, and by late 2017 both sales and total tax receipts were more than 10 percent above year-ago levels, improving the outlook for future fiscal years (Chart 6).
Chart 6. Oklahoma State Tax Revenues
Source: OK Tax Commission
Commodity industry outlooks continue to improve
The broad-based improvement in Oklahoma’s economy since mid-2017, along with continued growth in the national economy, should bode well for the state’s outlook in 2018. However, the outlook for specific industries that make the state unique from other parts of the country also matters, as was evident in the state’s commodity-driven recession of 2015-16.
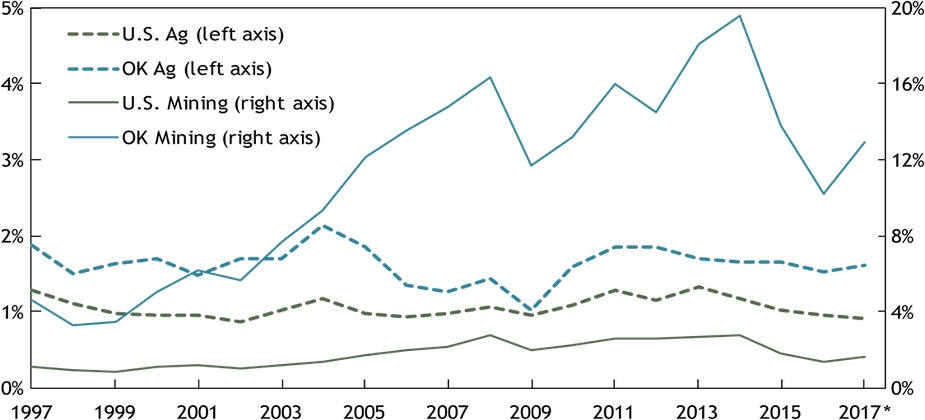
Agriculture and, especially, energy are much more important industries in Oklahoma than nationally, whereas most other industries in the state are of a relatively similar scale as in the nation. Agriculture has consistently been nearly twice as important in Oklahoma as in the nation in recent decades, representing almost 2 percent of the state’s GDP in 2017. In many nonmetro areas of the state, the sector’s importance is even greater, as reviewed in the third quarter Oklahoma Economist. Meanwhile, the state’s mining sector, despite shrinking somewhat the past three years, remains over seven times as large as in the country as a whole, at nearly 12 percent of state GDP (Chart 7).
Chart 7. Mining and Agriculture Share of GDP, 1997 - Q2 2017
Source: BEA
In addition, other sectors of the state’s economy often depend on conditions in the agriculture and energy sectors. For example, manufacturers of agricultural and energy equipment, trucking firms that transport commodities, restaurants and hotels in commodity-dependent areas, and other firms, can be heavily affected by commodity price trends. As such, the reach of the agriculture and energy industries extends well beyond their direct share of GDP.
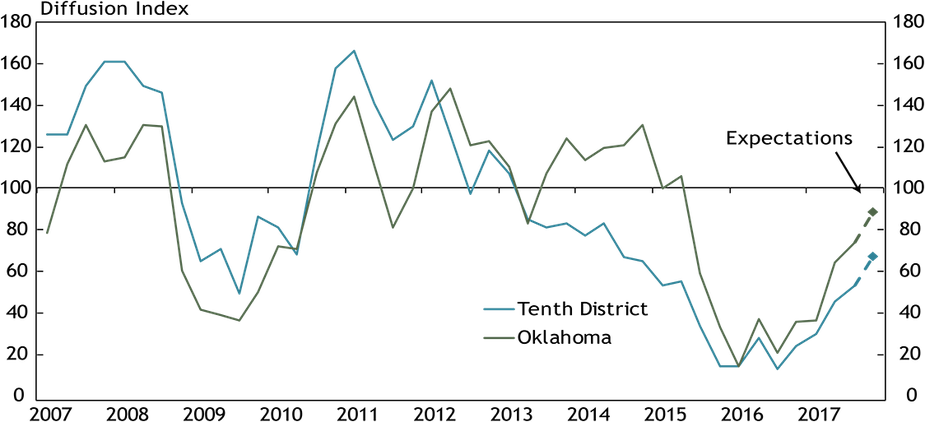
Conditions in the state’s agriculture industry remain somewhat subdued, but less so than a year ago. An index for farm incomes in Oklahoma and in the Federal Reserve’s Tenth District shows that incomes continue to fall slightly, as evidenced by the index remaining below 100 (Chart 8).
Chart 8. Farm Income
Source: KCFRB Agricultural Credit Survey
However, the decline in the third quarter was less severe than in previous quarters, as prices for some key commodities in Oklahoma, including cattle and cotton, have increased this year. In addition, expectations for future farm incomes were for further improvement.
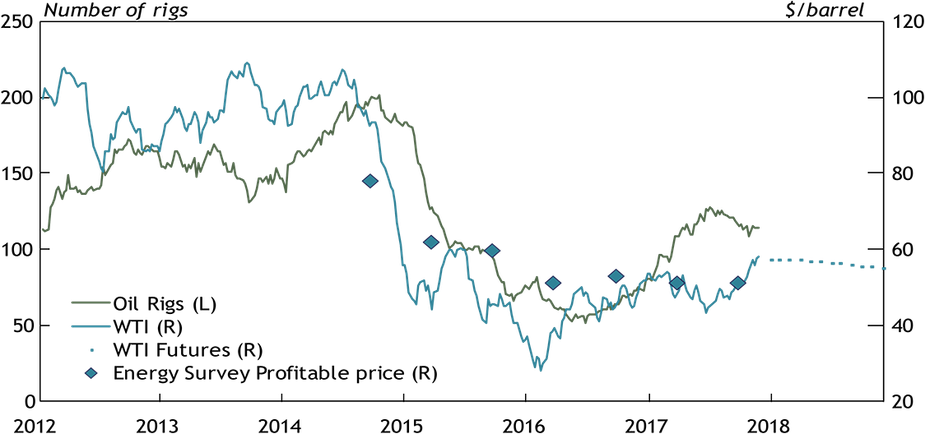
In the energy sector, following a strong rise in oil drilling in Oklahoma from mid-2016 to mid-2017, the state’s rig count drifted down somewhat in the third quarter (Chart 9).
Chart 9. Oklahoma Oil Rigs and Oil Prices
Sources: EIA, Baker Hughes, KCFRB Energy Survey
However, prices for a barrel of West Texas Intermediate oil have risen into the high $50s again in late 2017, above prices firms have said are needed for profitability in the most recent Kansas City Fed Energy Survey. The average oil price regional oil and gas firms say they need to be profitable is $51 a barrel. As such, the rig count has improved slightly and may be poised for more growth if oil prices remain elevated.
Summary
Oklahoma’s economy experienced a welcome rebound in 2017, as a turnaround in the state’s important energy sector spread to other industries, and the agriculture sector stabilized. This resulted in broad-based improvement in jobs in most state industries by late in the year. As such, unemployment has fallen back to nearly the national rate, and state tax revenues have risen solidly in 2017. The outlooks for both the agriculture and energy sectors have also improved in the second half of 2017 with rising commodity prices, presenting additional confidence for the state’s economic outlook in 2018.
Endnotes
-
1
The state GDP numbers referenced here include data for the first quarter of 2014 to the second quarter of 2017 that were revised in November by the U.S. Bureau of Economic Analysis to “incorporate source data that are more complete.”
-
2
See, for example, “Identifying State-Level Recessions” by Jason P. Brown in the first quarter 2017 edition of the Kansas City Fed’s Economic Review.
