The COVID-19 pandemic initiated a historic shift in the way people use their homes, prompting millions of Americans to spend an uncharacteristically large amount of time at their residences. What was initially seen as a temporary response to a health emergency transformed into a longer-term shift in mobility patterns as the pandemic persisted through 2021. The need to use homes as offices, classrooms and havens from crowds appears to have altered outcomes in residential real estate markets, potentially in a way that lasts even as public health conditions improve. In particular, shifting mobility patterns appear to have contributed to rising home prices in the Rocky Mountain region over the past year. In this edition of the Rocky Mountain Economist, we show that individual counties, and even entire states, where residents continue to spend more time at home have experienced faster growth in home prices. As people continue to use their homes differently, even as economies reopen, some of the local increases in residential real estate values may persist.
Changes in Mobility Patterns in the Rocky Mountain Region
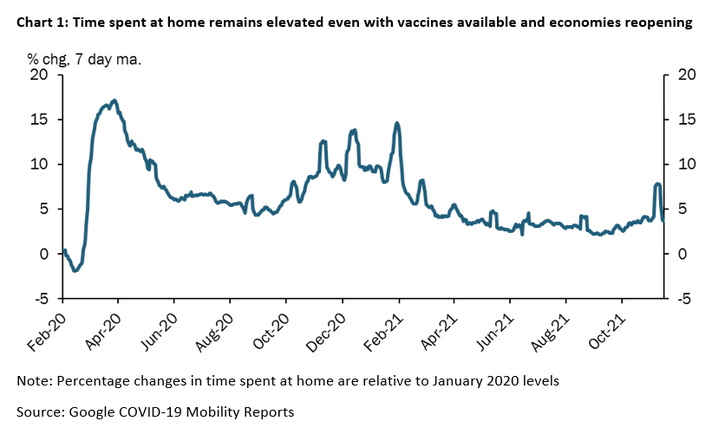
Like the rest of the United States, the Rocky Mountain region experienced drastic changes in mobility patterns during the pandemic. The first wave of the pandemic in March 2020 led to state-mandated shutdowns of businesses, restrictions on travel, and stay-at-home orders that inhibited the movement of individuals. During this period, the Rocky Mountain region saw a sharp increase in the time people spent at their residence. At its peak, the amount of time people spent at home was nearly 17% above its pre-pandemic level (Chart 1). This increase in time spent at home has since moderated from its historic high during the summer of 2020 as public health restrictions were eased. Residential mobility subsequently ebbed and flowed, coinciding with the waves of the pandemic. The shift in mobility patterns began to settle in the spring of 2021, as vaccines first became widely available. Still, time spent at home remains 3-5% above normal levels across the nation.
While people are generally spending more time at home throughout the Rocky Mountain region, the reopening and resumption of normal activities differs across states and communities. Wyoming experienced the least severe change in residential mobility patterns at the start of the pandemic, and is currently the closest to its pre-pandemic baseline. This can be partially attributed to the difference in approach to public health measures instituted at the beginning of the pandemic, which set a precedent for mobility patterns moving forward. Conversely, Colorado and New Mexico instituted stricter classifications for essential businesses and activities, which translated to larger increases in time spent at home statewide. Mobility patterns differed significantly across counties as well, even within the same state. When the average amount of time spent at home was closest to its pre-pandemic level in September 2021, shifts in residential mobility across the region ranged from -2% for some counties, indicating less time spent at home than before the pandemic, up to nearly 10% more time spent at home.
Growth in Home Prices Greater in Communities with More Time Spent at Home
The unprecedented shift in mobility patterns represents a change in homeowner behavior that can influence residential real estate activity in several ways. Many homeowners have been less inclined to list and sell the homes that they are now using more intensively, limiting the supply of homes available for sale, particularly in areas where mobility remained subdued. Others have sought new homes to accommodate their novel needs and opportunities for remote work.i These lifestyle changes associated with lower mobility can add demand for housing and local amenities that were less utilized prior to the pandemic. Whether by affecting the local supply of housing for sale or the demand for homes and local amenities, these shifts can directly influence growth in the price of housing.
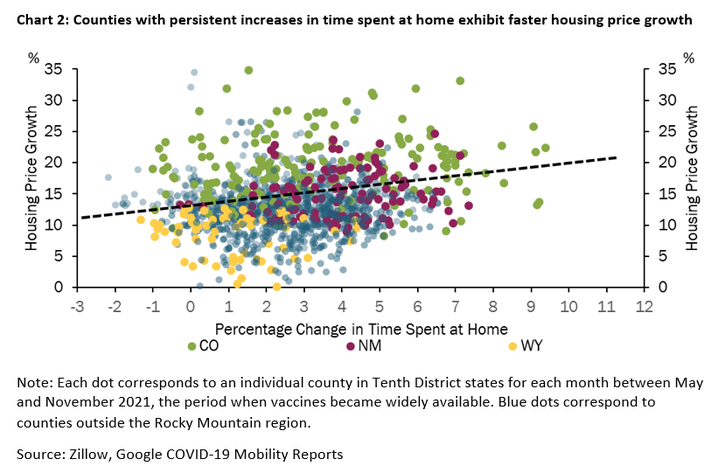
Locations where the time residents spend at home has remained elevated through 2021 tend to be those where housing prices have grown fastest. Chart 2 shows the simple correlation between growth in housing prices over the past year and shifts in mobility patterns for all counties in the states of the Federal Reserve Bank of Kansas City’s Tenth District – Colorado, New Mexico and Wyoming, shown in different color dots, as well as Kansas, Missouri, Nebraska, and Oklahoma, all shown in blue. The simple correlation across counties and states in Chart 2 is illustrative, but does not account for other factors that influenced housing prices across states or throughout the months of the pandemic. Using a more sophisticated model, we estimate that, over the past nine months, 5% more time at home corresponds with an additional 2.5-4% growth in housing prices across counties.ii The link between growth in housing prices and residents’ mobility holds across the spectrum of housing being sold. Sales of homes in the lower-, mid- and upper-tier of each county’s price ranges all exhibit a tight connection between time spent at home and rising home values during the latter part of the pandemic.
Rising Home Prices
Growth in housing prices accelerated throughout 2021 across most states. On average, homes in the mid-tier of each county’s price ranges increased by approximately 15%. Many factors likely contributed to the overall acceleration of growth in home prices. A strong fiscal response during the pandemic supported the recovery in employment levels and contributed spending power to households directly in the form of stimulus payments. Accommodative monetary policy added purchasing power for households that could take on mortgage debt at low interest rates. Other regulatory policies that allowed forbearance for homeowners affected by the pandemic mitigated downward pressures on prices that might have resulted from individuals otherwise seeking to limit their debt burden rapidly. All of these factors likely provided a temporary boost to asset prices, including home values. While these policies were temporary, they likely contributed more to overall growth in housing prices than did shifts in mobility patterns. With an average of 3-5% more time spent at home across the region – corresponding to 2.5-4% faster growth in housing prices– changes in mobility can explain only a portion of rising home values over the past year. Still, these policies were temporary interventions. Shifts in homeowners’ private decisions about how they use their homes may be more permeant. The broad connection between mobility and housing price growth – showing up across price ranges, across geographies and through time as mobility patterns stabilized – suggests the excess growth in home values where mobility remains subdued is likely to be a persistent feature of these local markets.
Interested in learning more about the economics of where you work? Click here.
_________________________
i Research External Linkhere from the KC Fed by External LinkJordan Rappaport highlights the shifts where people may choose to reside.
ii Specifically, we estimated a regression of county-level housing price growth year-over-year on county-specific changes in residential mobility, including an interaction between mobility and month fixed effects and also included state fixed effects, using data spanning January 2020 to November 2021. Alternatively we estimated a model grouping months into three periods, corresponding to wave of the pandemic and the availability of vaccines. In all specifications the positive relationship between time spent at home and growth in housing prices was evident with high degrees of confidence.
The views expressed are those of the authors and do not necessarily reflect the positions of the Federal Reserve Bank of Kansas City or the Federal Reserve System.
Authors

Nicholas Sly
Vice President, Economist, and Denver Branch Executive