Growth in the average size of farm operating loans boosted agricultural lending in the second quarter of 2019. The size of farm loans has continued to rise and loans exceeding $1 million recently have had a significant effect on the overall volume of new loan originations. The average duration of farm loans also has lengthened alongside elevated demand for financing, another potential signal of increased credit stress.
Section A – Second Quarter National Farm Loan Data
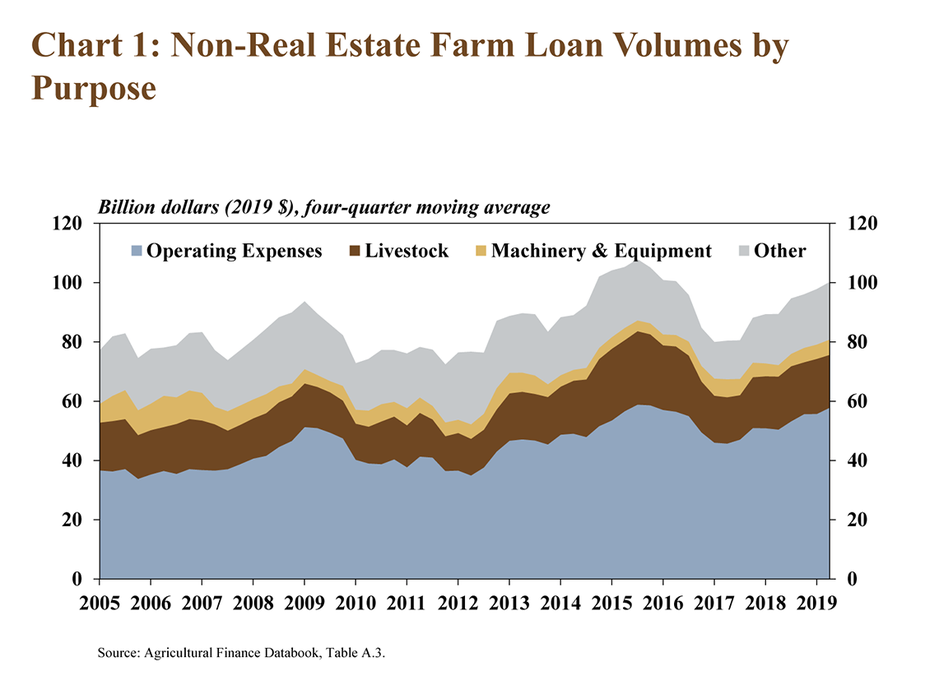
Non-real estate farm lending continued to increase at a moderate pace in the second quarter, according to the National Survey of Terms of Lending to Farmers. The volume of loans increased 11 percent compared with last year, the fastest pace of growth in the second quarter since 2011. Operating loans continued to comprise the majority of non-real estate farm lending and increased more than 16 percent (Chart 1). The second quarter also marked the ninth straight quarter of a year-over-year increase in total non-real estate loan volumes and during these nine quarters, the annual pace of growth has averaged 14 percent.
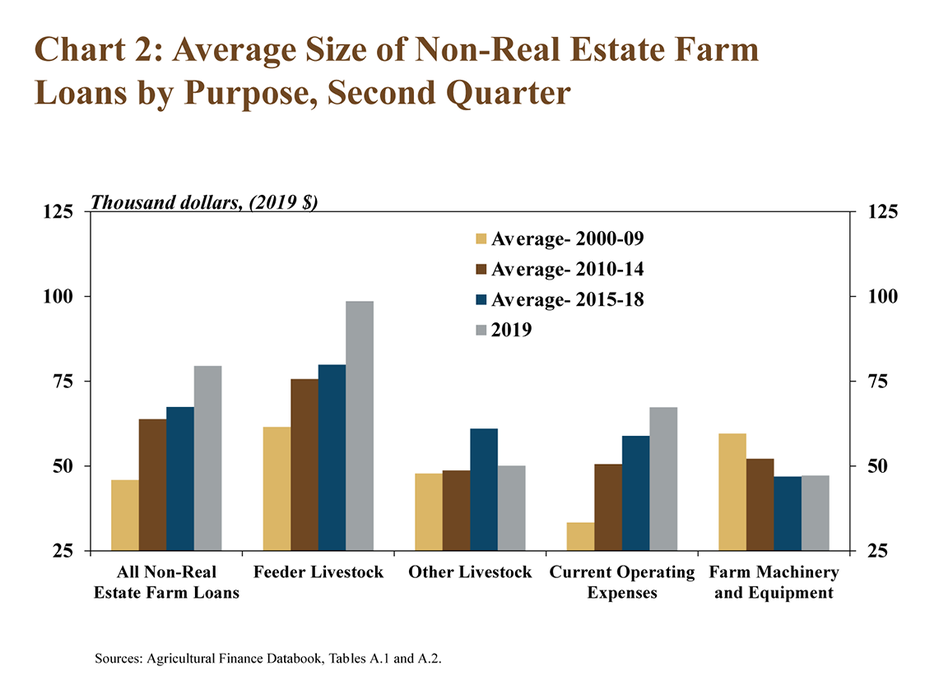
The increase in loan volumes continued to be driven by larger-sized loans. The average amount of non-real estate farm loans in recent years has increased steadily. Compared with the period between 2000 and 2009, the average size of all non-real estate loans in the second quarter was nearly $34,000 larger in 2019 (Chart 2). Over that period, feeder livestock loans were nearly $40,000 larger while loans to fund current operating expenses more than doubled and were about $34,000 larger than the first decade of the 2000s.
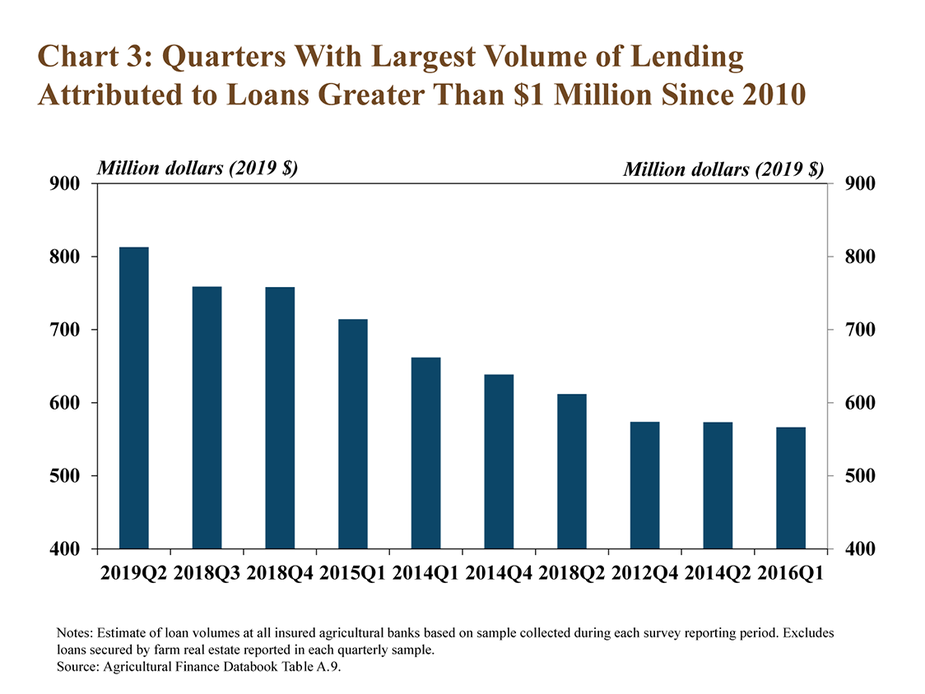
The volume of non-real estate farm loans exceeding $1 million was notably higher than previous years and contributed significantly to the average size of loans. According to the survey data, the volume of new non-real estate loan originations at commercial banks totaled more than $800 million in the second quarter (Chart 3). Large loans also contributed significantly to increased agricultural lending activity at commercial banks in the second half of 2018.
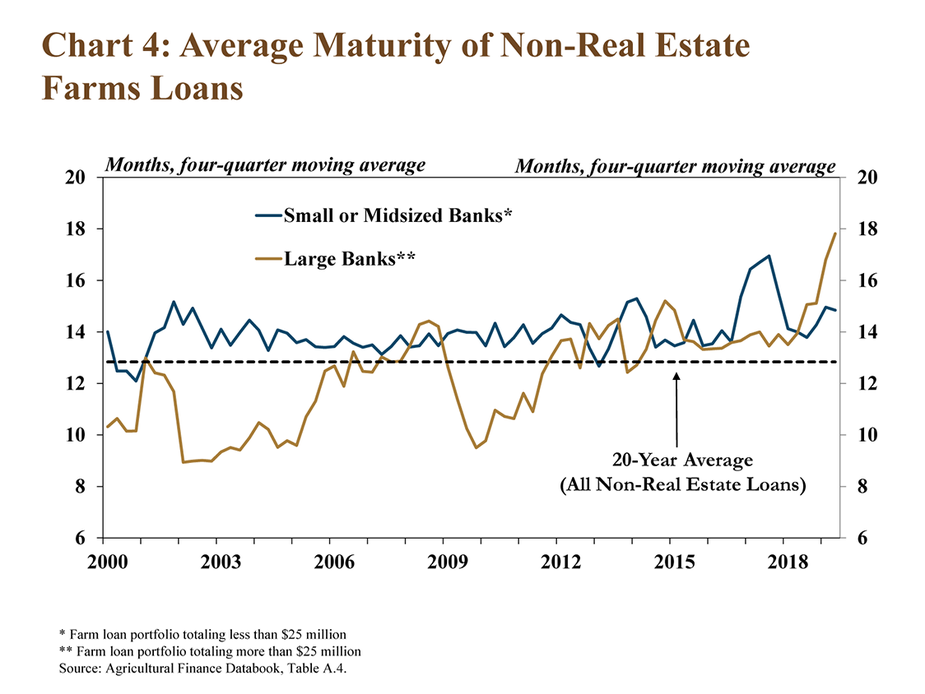
Alongside larger-sized loans, loan durations in recent quarters also have increased. Compared with a year ago, the average duration of all non-real estate farm loans in the second quarter increased nearly three months. That increase was driven by maturities on new loans at the largest agricultural banks (Chart 4). The average duration at the smallest agricultural banks declined slightly from a year ago, but remained above recent historical norms. Durations at the largest banks continued to trend upward, increasing about four months.
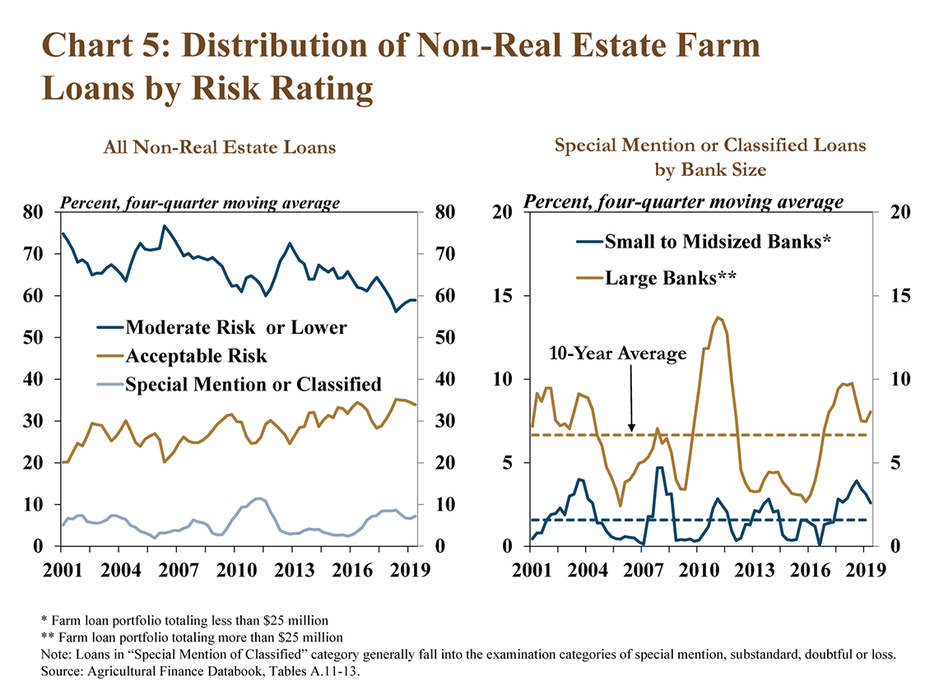
While the average risk rating of all new non-real estate loans remained sound overall, the share of problem loans in recent years has increased slightly. Loans reported in the survey as classified most commonly are given to problem borrowers. After reaching a five-year high in 2018, the share of classified loans declined slightly in the first quarter, but remained above the average from 2008 to 2018 (Chart 5). This share remained slightly higher at the largest agricultural banks, totaling 8 percent on a rolling four quarter basis, compared with under 3 percent at the smallest banks.
Section B – First Quarter Call Report Data
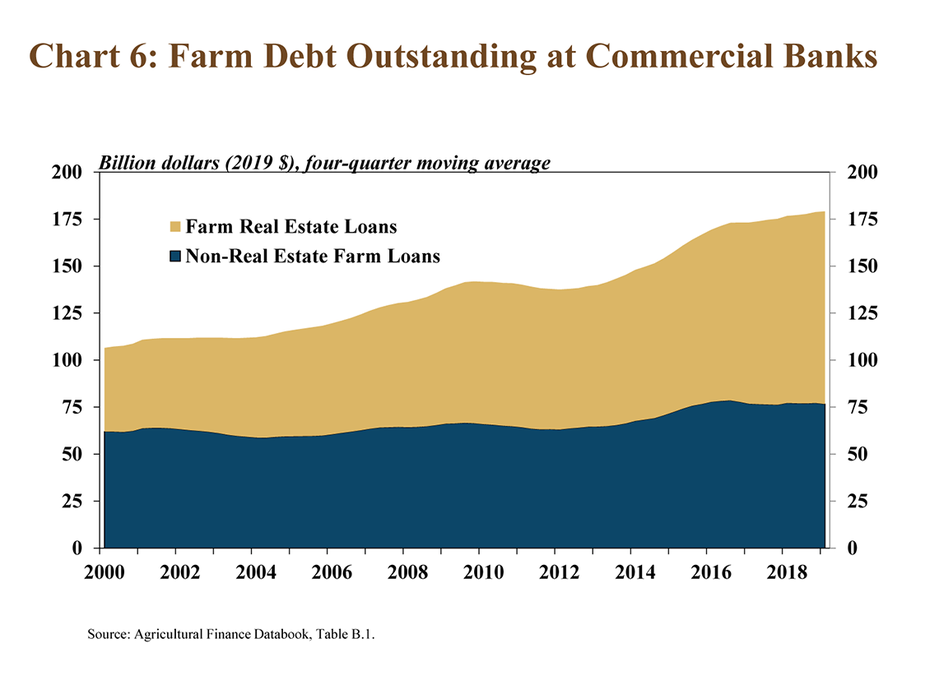
Total farm debt outstanding at commercial banks continued to increase at a modest pace in the first quarter, according to Call Report data. Real estate loans drove the increase in total farm debt, growing over 2 percent from a year ago (Chart 6). Non-real estate farm debt declined slightly compared with last year, but remained elevated following an average quarterly growth rate in 2018 of more than 3 percent.
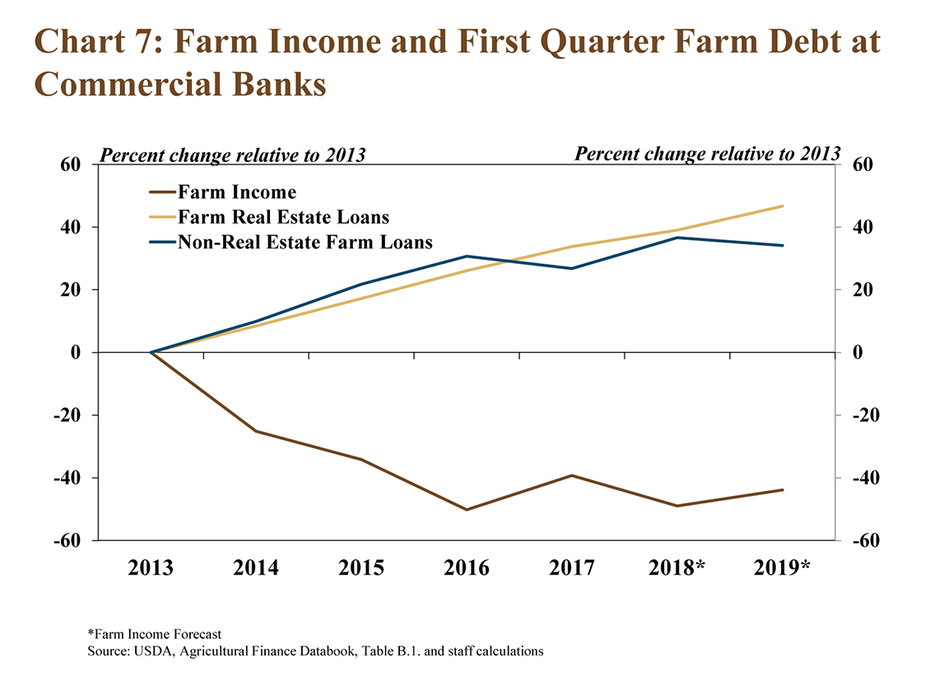
Several years of low farm income have weighed on farm borrowers and contributed to steady increases in farm real estate debt. Reduced cash flow generally leads to more borrowers with carry-over debt at year-end, and those outstanding debts are secured with longer-term assets such as farm real estate. In 2018, U.S. farm income was nearly 50 percent lower than 2013 and is forecast to remain 44 percent below that amount in 2019 (Chart 7). Over that same period, farm real estate debt has increased about 47 percent, an average annual pace of almost 8 percent.
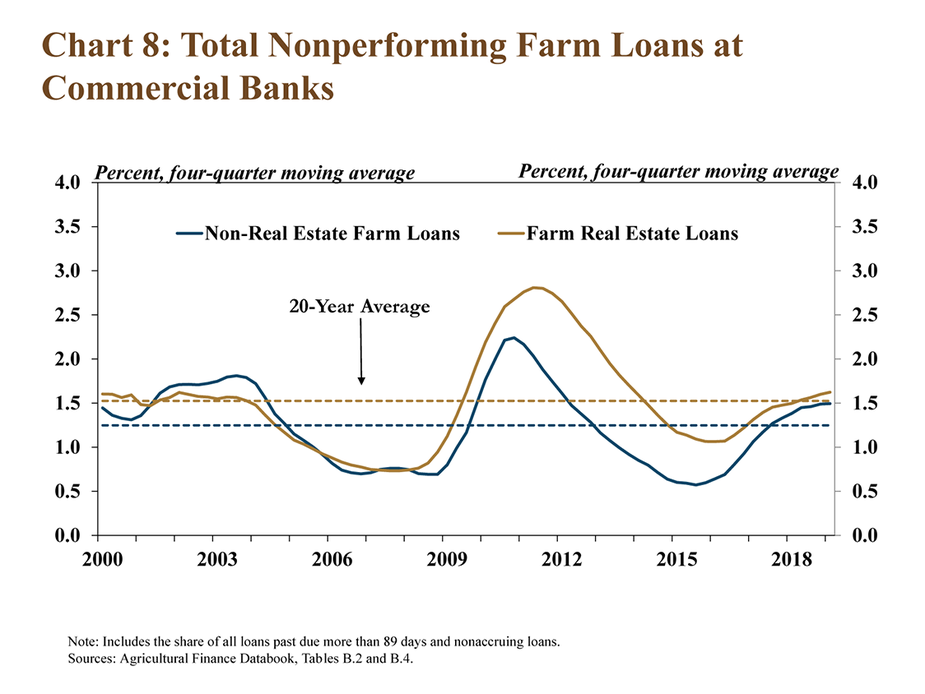
Alongside steady increases in farm debt, the rate of nonperformance on all types of agricultural loans also continued to increase at a modest pace in the second quarter. The share of nonperforming loans in the first quarter was 1.6 and 1.7 percent for non-real estate and real estate farm loans, respectively (Chart 8). The rate of nonperformance for both types of loans was above the average over the past 20 years, but remained well below the share reached during the Great Recession of 2007-09.
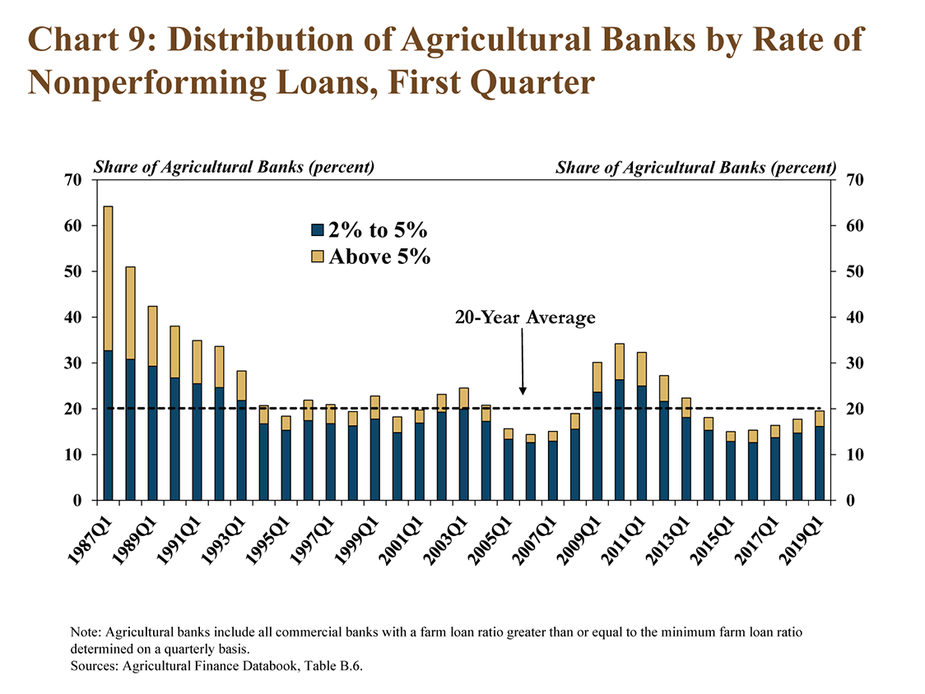
Similar to trends in the overall rate of nonperforming farm loans, the share of banks with weaker performance of agricultural loans also has increased slightly. About 20 percent of all agricultural banks had a rate of nonperforming farm loans above 2 percent in the first quarter, an increase from about 15 percent in 2015 (Chart 9). Despite increasing in recent years, that share has remained near the average of the past 20 years and well below the levels reached in the late 1980s and during the most recent recession.
Section C – First Quarter Regional Agricultural Data
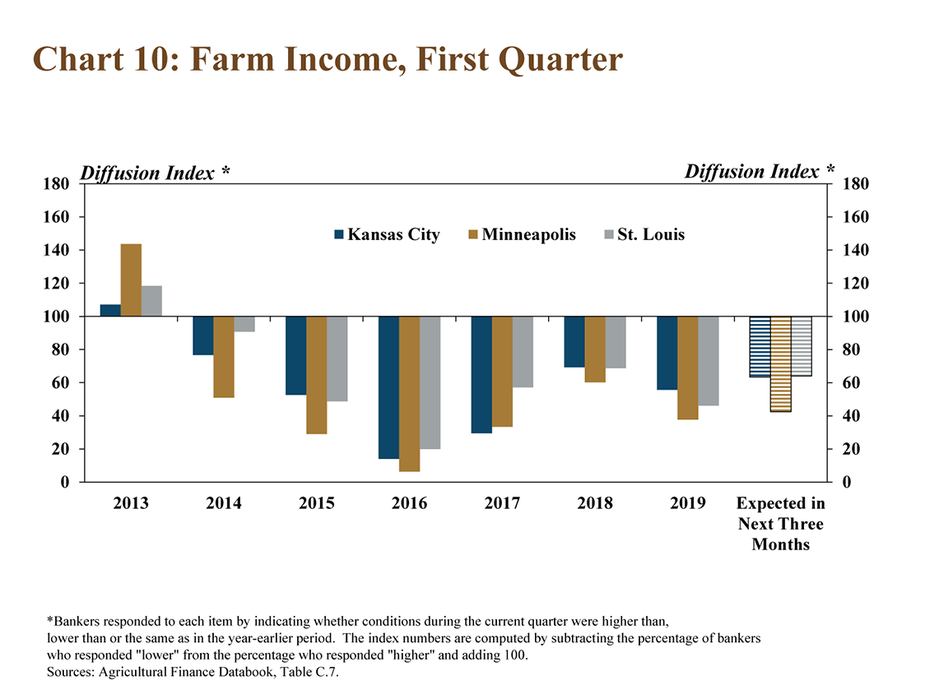
According to Federal Reserve District Surveys, farm income declined for the sixth consecutive year. In the three Districts that collect information about changes in farm income, the pace of decline in farm income was slightly faster than a year ago (Chart 10). Nearly 70 percent of bankers in the Minneapolis District reported that farm income was lower than a year ago, a slightly higher share than the other Districts. Respondents in all Districts also were pessimistic about the prospects for farm income moving forward.
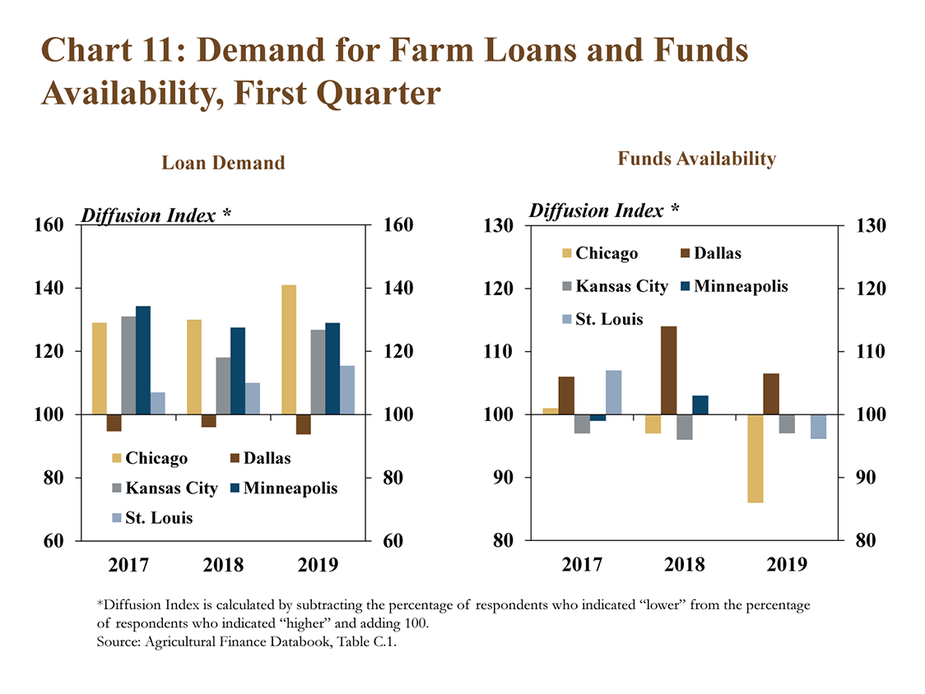
Alongside lower farm income, demand for farm loans remained strong. Several years of high lending demand has placed downward pressure on liquidity at agricultural banks (Chart 11). Farm loan demand continued to trend higher at a steady pace in all Districts with the exception of Dallas. The availability of funds also tightened across those Districts, and compared with other regions, the pace of change in loan demand and liquidity was slightly faster in the Chicago District.
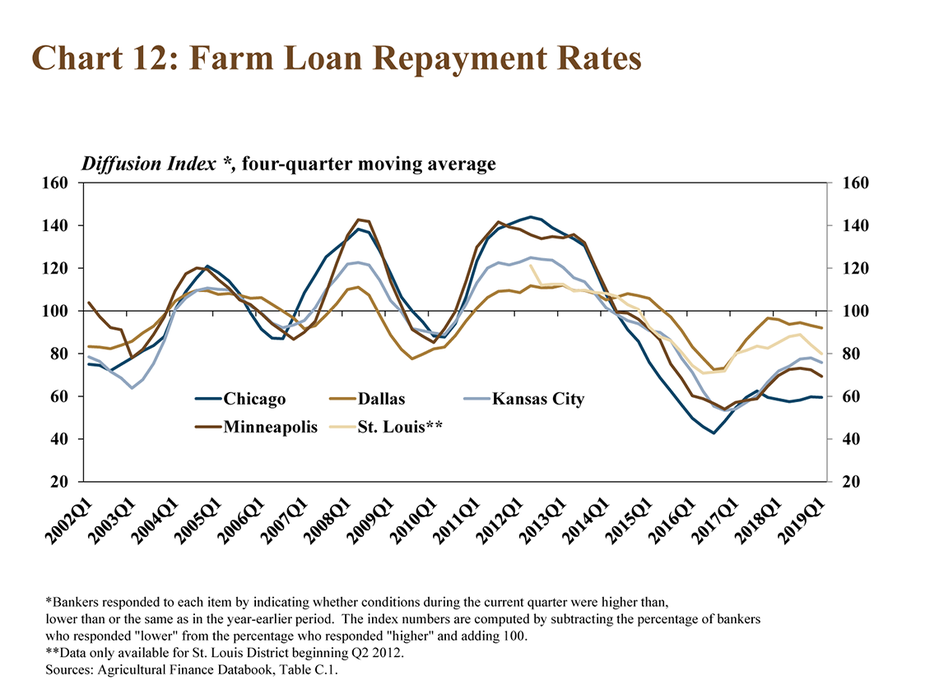
With continued strain on farm finances, repayment rates on farm loans also have declined for nearly six straight years. Compared with this time a year ago, the pace of decline was slightly faster across all Districts (Chart 12). Similar to loan demand and funds availability, respondents in the Chicago District continued to report a slightly faster pace of decline in repayment rates while the pace was comparably slower in the Dallas District.
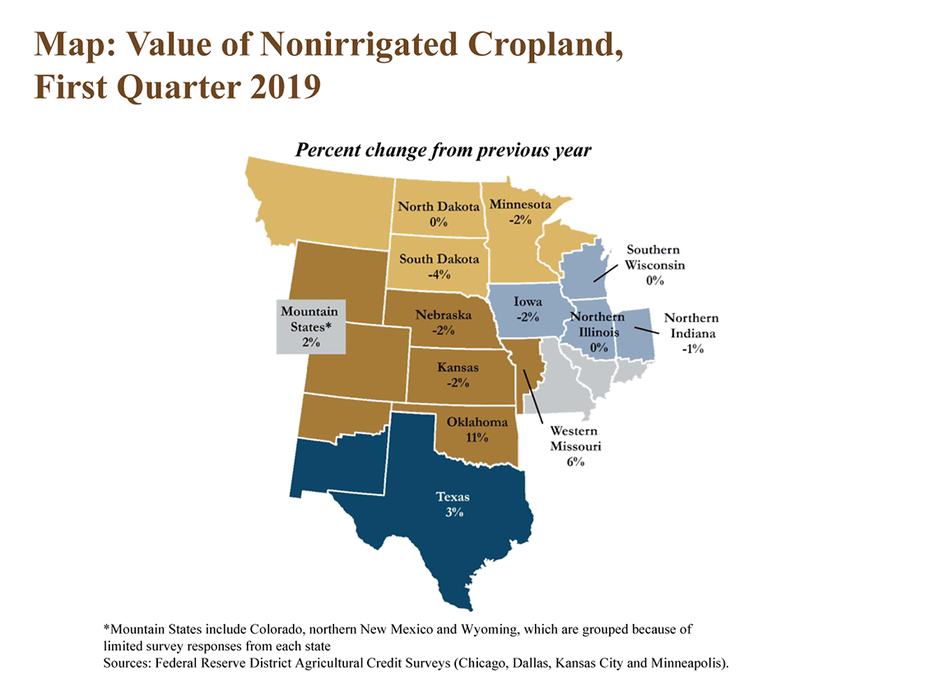
Despite continued weaknesses in the farm economy and mounting agricultural credit stress, farmland values were relatively steady. Changes from a year ago were less than 3 percent in most states (Map). The value of nonirrigated farmland increased moderately in Oklahoma and also increased slightly in Texas, states more heavily concentrated in energy production. Cropland values declined modestly in most other states.
Conclusion
The volume of non-real estate farm lending grew at a moderate pace due to new loans in excess of $1 million. Alongside ongoing increases in demand for financing, the share of nonperforming agricultural loans has continued to trend upward. Bankers also reported additional declines in farm loan repayment rates, a potential leading indicator of past-due loans. However, the overall increase in financial stress in agricultural lending has remained relatively modest and stability in the value of farm real estate has remained an ongoing source of support.
Data and Information
The views expressed are those of the authors and do not necessarily reflect the positions of the Federal Reserve Bank of Kansas City or the Federal Reserve System.
Authors

Nate Kauffman
Senior Vice President, Economist, and Omaha Branch Executive; Executive Director of the Center for Agriculture and the Economy
