Farm lending activity declined for a second consecutive quarter at commercial banks as 2019 closed. A reduction in non-real estate farm lending, particularly for operating loans, was the primary contributor to a reduced volume of loans at banks with portfolios concentrated in agriculture. The declines came alongside an additional reduction in production expenses, but reduced loan demand likely also was due to an increase in revenue from government payments (Market Facilitation Program) connected to trade disputes that lingered through the year.
Section A – Fourth Quarter National Farm Loan Data
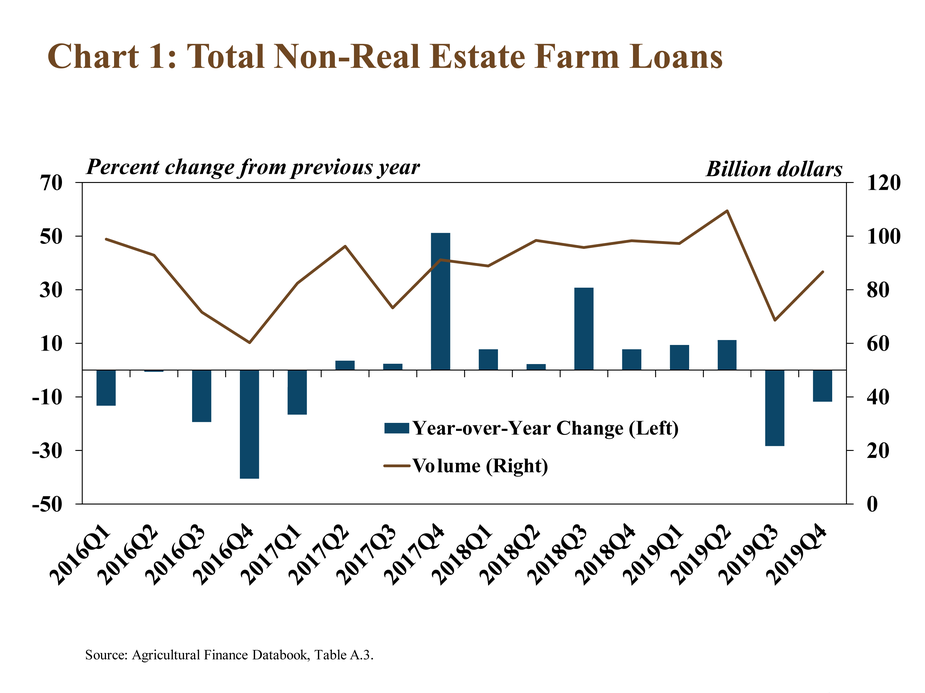
The volume of agricultural lending at commercial banks remained elevated, but declined for a second consecutive quarter. Total non-real estate farm loans decreased about 12 percent in the fourth quarter and declined over consecutive quarters for the first time since early 2017 (Chart 1). Following average annual growth of more than 10 percent in 2017 and 2018 and several quarters of sharp increases, lending activity contracted in the second half of the year and, on average, was 5 percent lower in 2019.
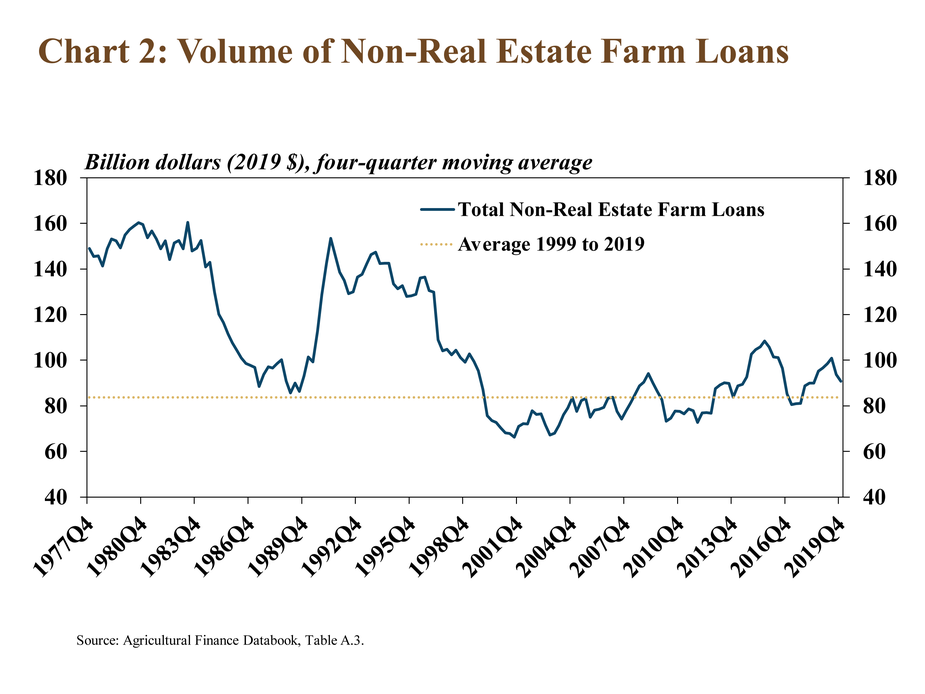
Despite decreasing from a year ago, farm lending volumes remained higher than the 20-year average. Total volume of non-real estate loans averaged about $90 billion in 2019 and was about 8 percent above the average since 1999 (Chart 2). Overall, persistent weaknesses in the farm sector have continued to stimulate strong demand for agricultural lending, although Market Facilitation Program payments in the second half of 2019 and relatively strong crop yields may have curbed demand in the fourth quarter. In fact, on a rolling four-quarter basis, farm lending has been above the recent historical norm for all but three quarters since 2014.
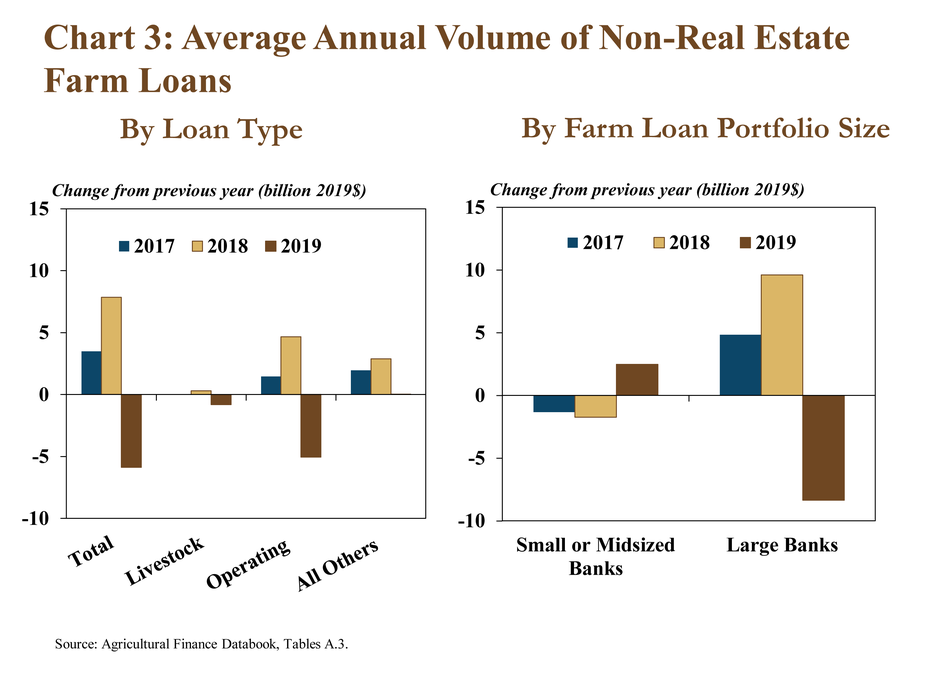
The slight pullback in agricultural lending during 2019 was driven by a decrease in the volume of operating loans and lending at banks with large farm loan portfolios. Nearly all of the $6 billion decline in the average volume of non-real estate loans in 2019 was attributed to operating loans (Chart 3). In addition, non-real estate lending at banks with farm loan portfolios larger than $25 million decreased about $8 billion, but increased more than $2 billion at banks below that threshold in 2019.
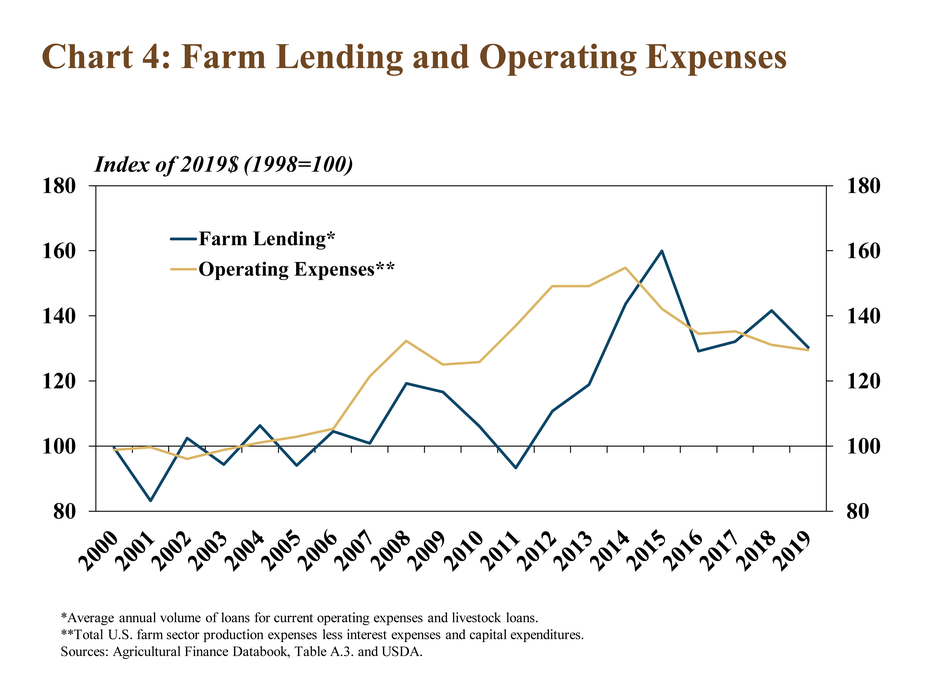
In addition to recent government payments and increased production, lower production expenses likely also have limited demand for farm loans. Adjusted for inflation, 2019 agricultural production expenses were more than 15 percent lower than the historical highs in 2014. Similarly, farm operating and livestock loans have edged lower in 2019 and have declined about 9 percent since 2014 (Chart 4). A decrease in crop input expenses and lower feed costs accounted for the majority of the decline in total expenses, and that drop has contributed to a modest reduction in demand for credit.
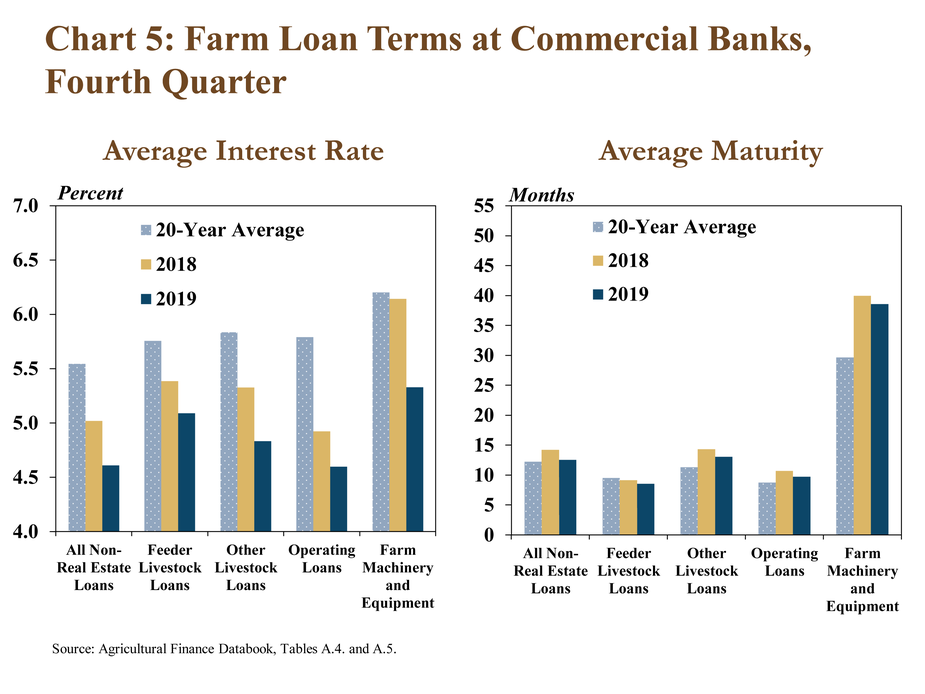
Alongside reduced loan volumes in the fourth quarter, the average interest rate and maturity of new loans declined slightly. Interest rates on all loan types remained well below the 20-year average while maturities remained slightly above the average for most loan types (Chart 5). The decline in both interest rates and maturities was largest for machinery and equipment loans. In addition, the decreases also were slightly greater at banks with larger farm loan portfolios.
Section B – Third Quarter Call Report Data
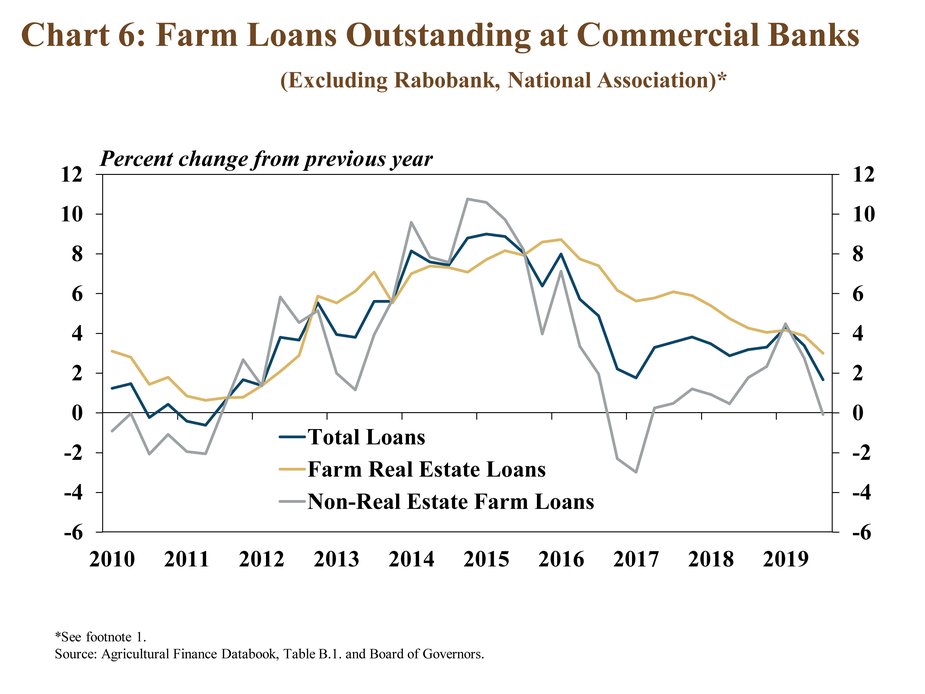
Farm loans outstanding at commercial banks declined through the third quarter, according to Call Report data. Total agricultural loans decreased from the previous year for the first time since 2011, due primarily to the exit of a large agricultural loan portfolio from commercial bank reporting (Chart 6). Excluding all loans at that institution, farm real estate debt increased 3 percent and non-real estate loan balances were little changed. Increases in farm real estate loans continued to support steady growth in total agricultural debt at commercial banks through the third quarter, but the pace of growth slowed.
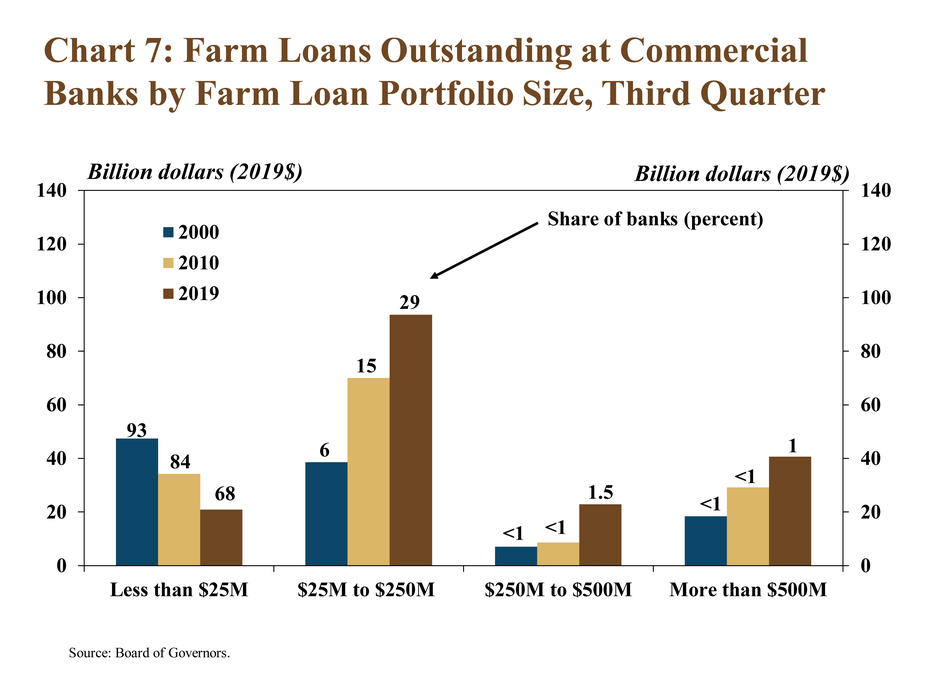
As farm debt at commercial banks has increased in recent years, lending also has become more concentrated among a smaller share of institutions. Banks with farm loan portfolios greater than $250 million held 36 percent of outstanding balances through the third quarter, compared with 23 percent in 2000 (Chart 7). General inflation has contributed to the growth in the size of farm loan portfolios at larger institutions. However, consolidation and other factors also are likely to have contributed to an increased concentration of agricultural lending at commercial banks.
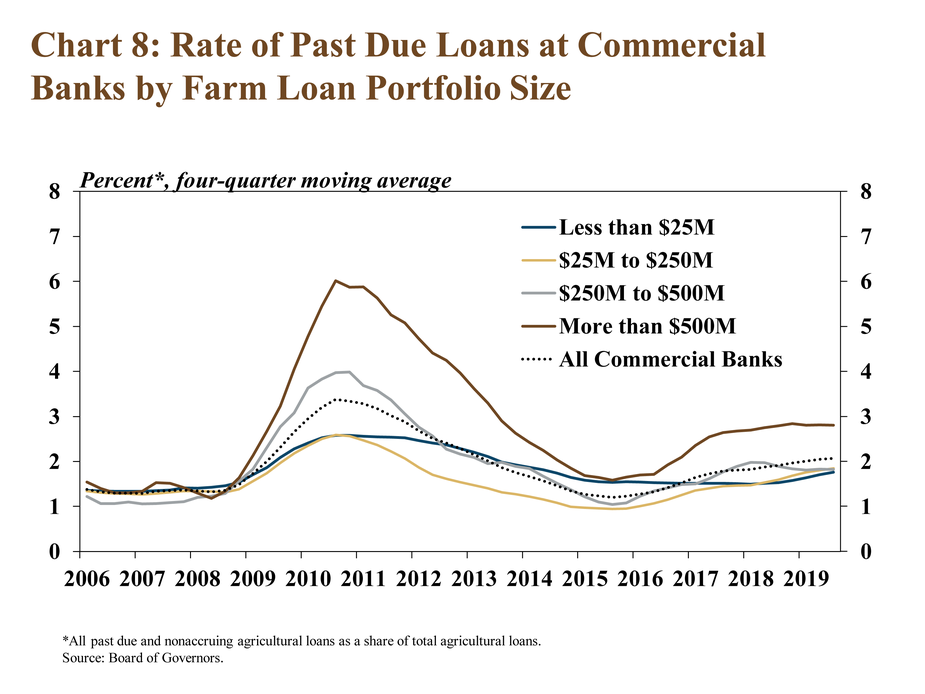
Delinquency rates on farm loans continued to increase at a modest pace through the third quarter alongside elevated levels of farm debt. While remaining historically low, loans that were considered past due at banks with the largest farm loan portfolios were higher than at institutions smaller in size (Chart 8). Since 2015, the share of farm loans past due at banks with farm loan portfolios more than $500 million have been about 70 basis points higher than the rate at all banks.
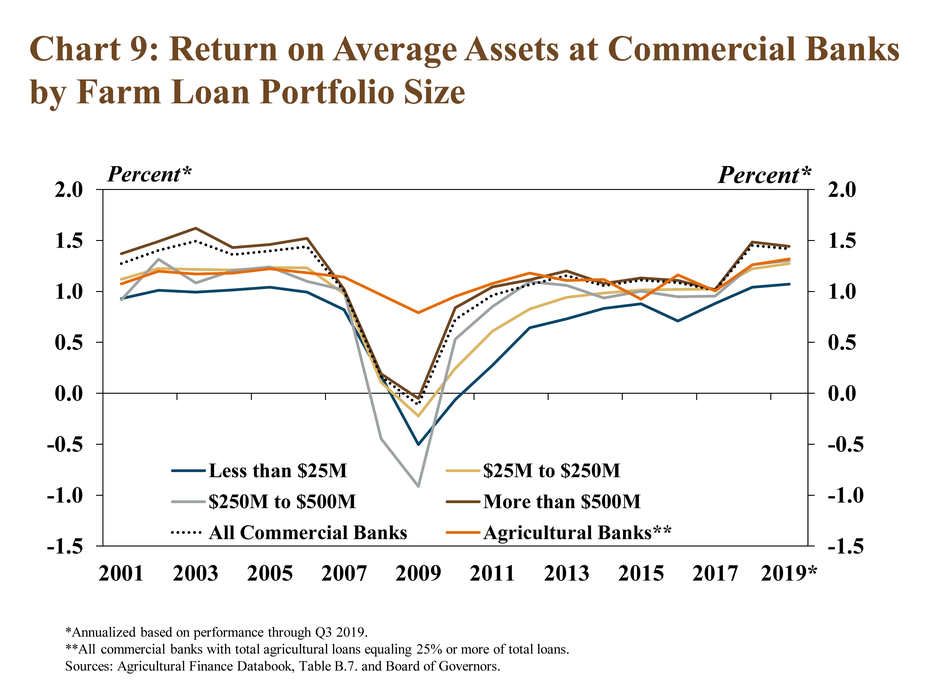
Despite an ongoing trend of increasing delinquency rates on farm loans, financial performance has remained relatively strong at agricultural banks. The return on assets at agricultural banks remained at a 20-year high, increasing slightly from a year ago (Chart 9). Moreover, even as profit margins among agricultural producers have remained subdued, returns at agricultural banks have kept pace with most other banks in recent years.
Section C – Third Quarter Regional Agricultural Data
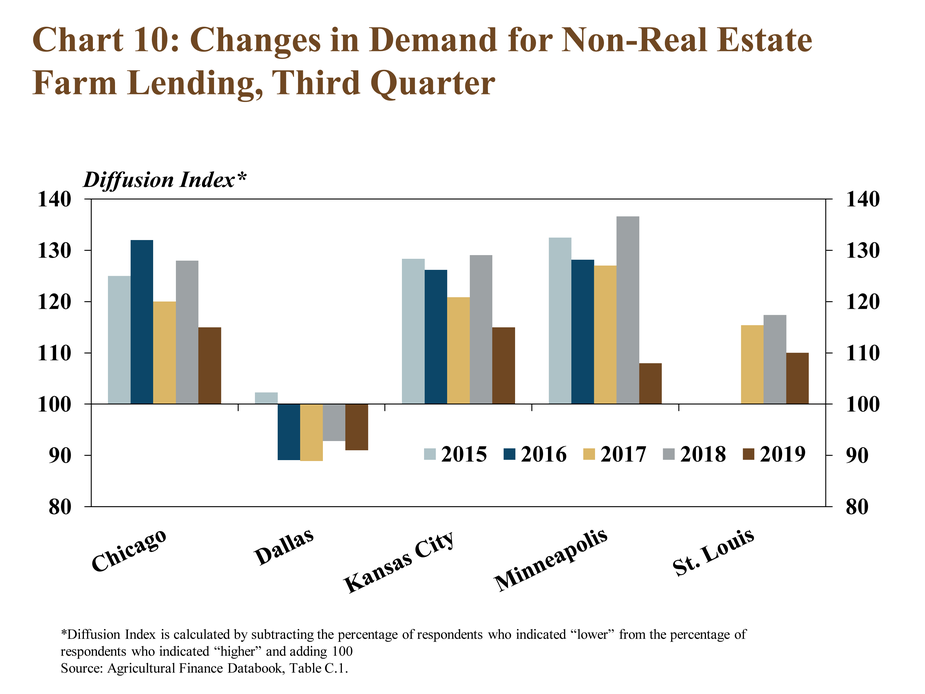
Similar to national trends, regional Federal Reserve surveys of agricultural credit conditions also indicated that demand for farm loans increased at a slower pace than recent years. While loan demand remained strong overall, the share of bankers reporting higher farm loan demand was lower in nearly all participating Districts (Chart 10). The pace slowed the most in the Minneapolis District and loan demand continued to contract in the Dallas District.
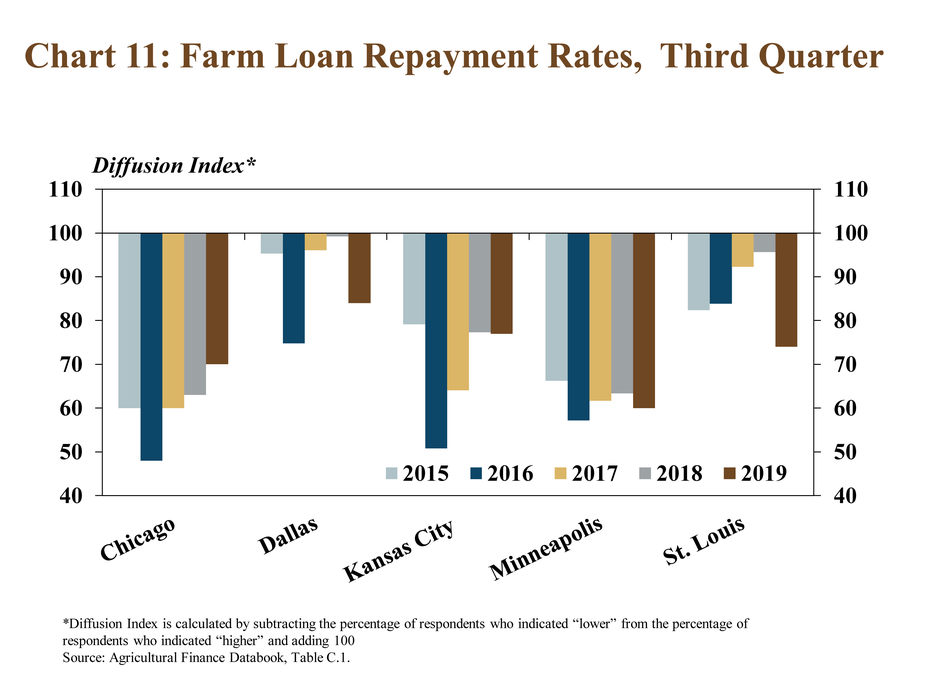
Alongside a slight increase in farm loan delinquency rates, regional contacts continued to report declines in farm loan repayment rates. The pace of decline in repayment rates increased from a year ago in all Districts expect Chicago (Chart 11). The pace of decline increased moderately in the Dallas and St. Louis Districts and slightly in Kansas City and Minneapolis.
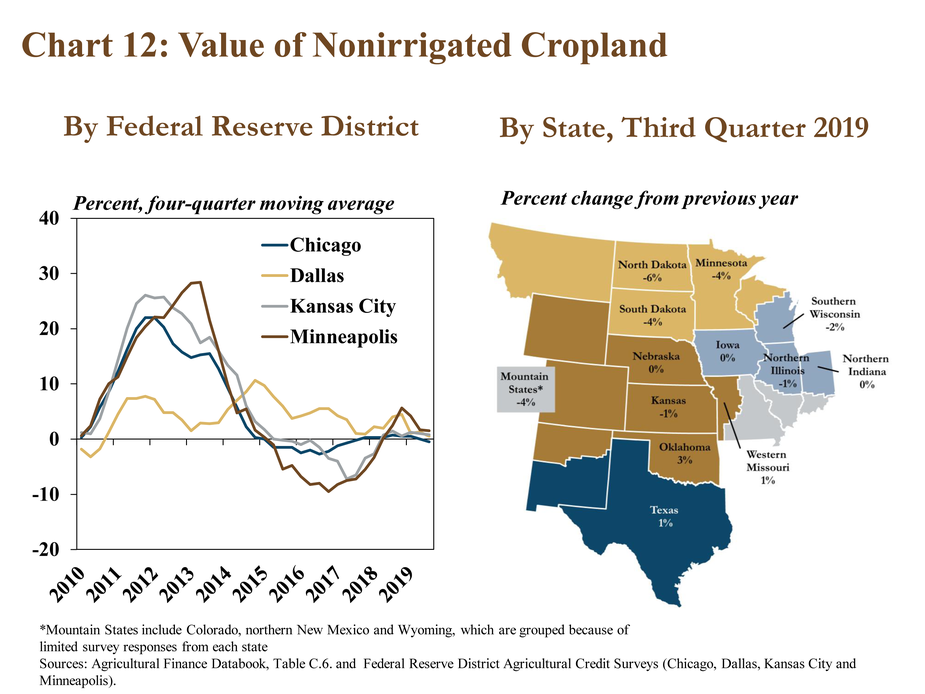
Similar to recent quarters, farm real estate values remained relatively stable. The average value of non-irrigated farmland in all participating Districts changed less than 2 percent in the third quarter (Chart 12). Declines were slightly larger in the northern most states during the third quarter, but remained modest; values increased slightly in Texas and Oklahoma.
Conclusion
The volume of new farm loans originated at commercial banks remained above recent historical norms, but continued to ease in the fourth quarter. The decrease in lending activity was driven by operating loans, which have declined in the past several years alongside relatively lower agricultural production expenses and, more recently, government payments. However, delinquency rates on farm loans continued to edge higher and the outlook for farm finances in 2020 will depend critically on cash flow projections and the need for financing operating loans in the new year.
Data and Information
The views expressed are those of the authors and do not necessarily reflect the positions of the Federal Reserve Bank of Kansas City or the Federal Reserve System.
Authors

Nate Kauffman
Senior Vice President, Economist, and Omaha Branch Executive; Executive Director of the Center for Agriculture and the Economy
