Farm lending activity at commercial banks slowed significantly in the fourth quarter as lenders and borrowers assessed economic prospects for 2017. Despite persistent increases in the level of outstanding farm debt and ongoing demand for loan renewals, new loan originations dropped sharply. Some of the reduced loan volume likely stemmed from lower costs of farm inputs. However, as the outlook for farm income generally has remained weak and farmland values have continued to decline, both lenders and borrowers may have been more apprehensive about adding new debt heading into 2017.
Section A – Fourth Quarter National Farm Loan Data
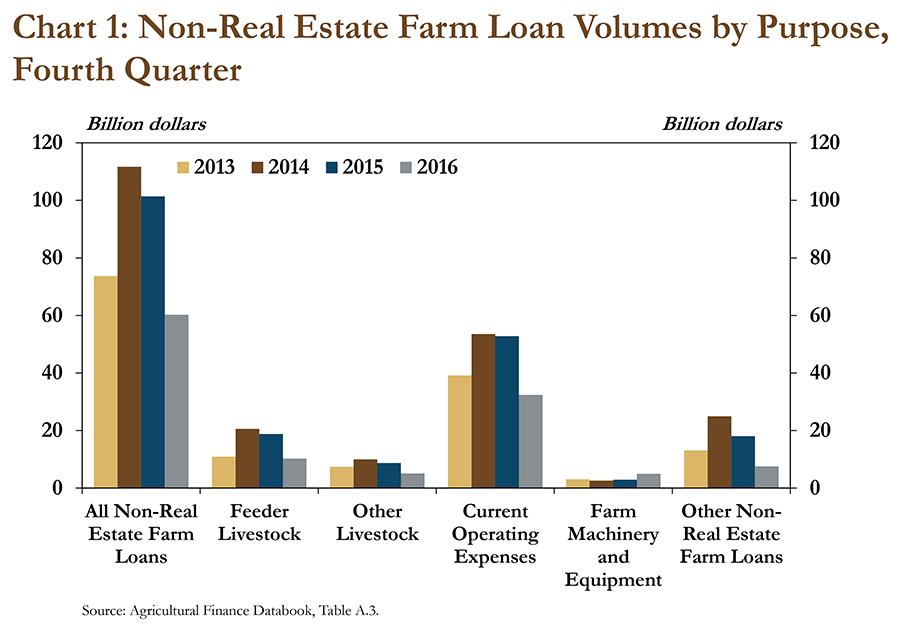
The volume of new farm loans dropped sharply in the fourth quarter of 2016, according to respondents to the Survey of Terms of Bank Lending to Farmers. The survey, which asks bankers about new loans to farmers, indicated the volume of non-real estate loans in the farm sector dropped 40 percent from a year ago. The 40-percent drop was the largest year-over-year decline in nearly 20 years (Chart 1).
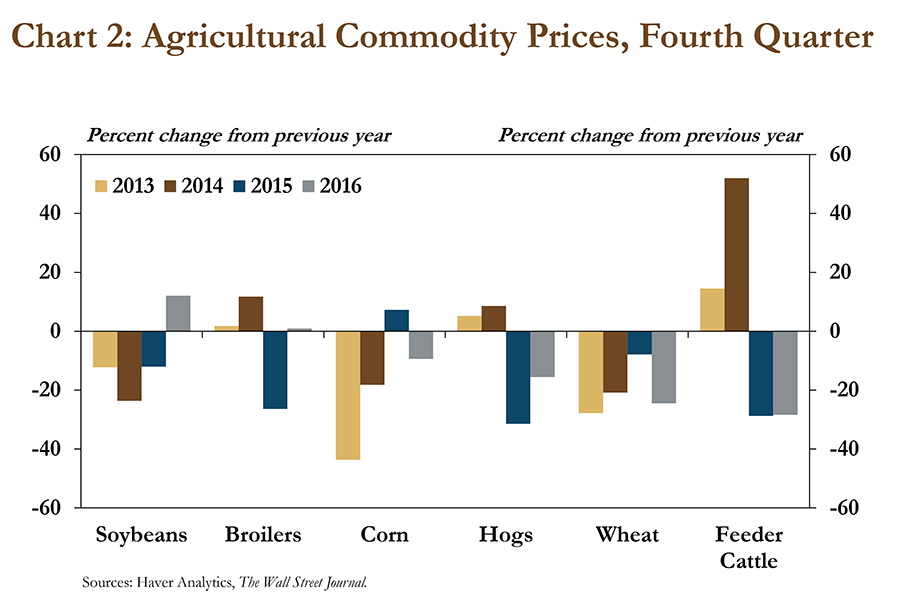
The sharp reduction in the volume of new farm loans at commercial banks occurred during a prolonged decline in farm revenue. In 2016, prices for most agricultural commodities continued to fall, building on the declines of previous years, with soybeans being a notable exception (Chart 2). A 30-percent year-over-year drop in the price of feeder cattle helped reduce the cost of purchasing the animals and likely contributed to the sharp reduction in loan volumes in the livestock sector. More generally, lower prices appeared to temper demand for new agricultural financing as producers tried to curtail expenditures. Some banks, recognizing greater risk in the farm sector, may have been more selective in financing new loan requests, and some financing decisions may have been delayed in the environment of heightened risk.
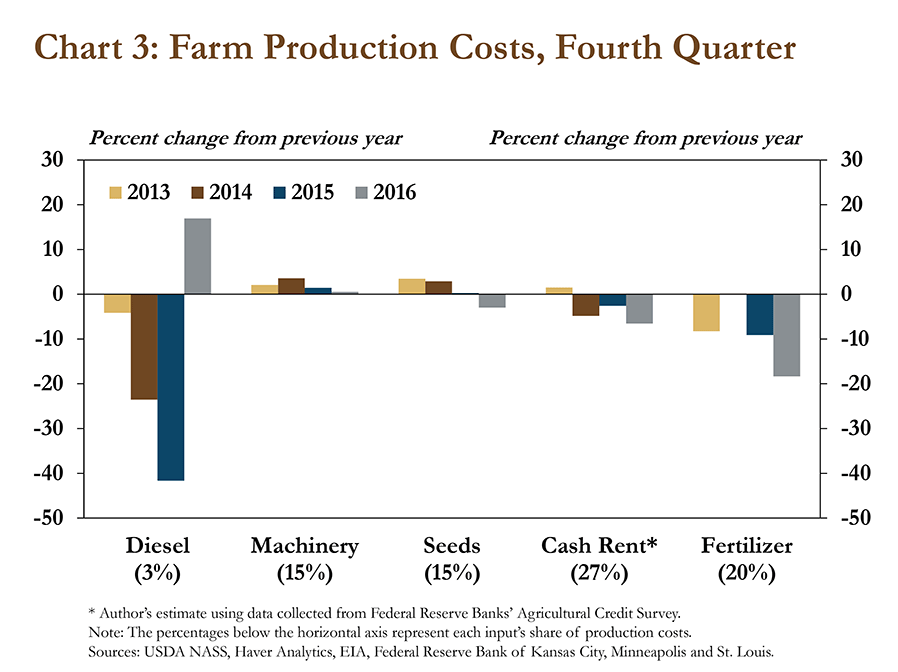
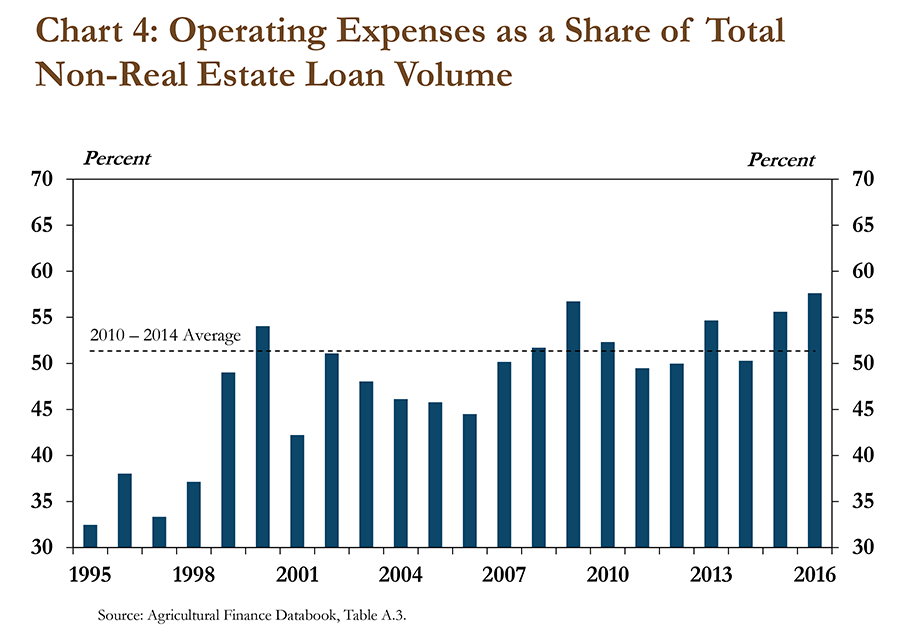
In addition to lower commodity prices, lower prices for agricultural inputs may have contributed to the drop in loan volume for items other than real estate. The cost of seeds, fertilizer and cash rents all were down from a year ago (Chart 3). The decline in input costs likely was a significant factor in reducing the volume of loans used, specifically, to finance operating expenses. For example, the U.S. Department of Agriculture (USDA) estimates that the cost of cash rent, fertilizer and seed accounted for more than 60 percent of the total cost of corn production in 2016.i Because loans used for operating expenses comprise about 60 percent of non-real estate loan volume, the decline in input expenses likely curbed the volume of new farm loans originated in the fourth quarter as farmers prepared for the 2017 planting season (Chart 4).
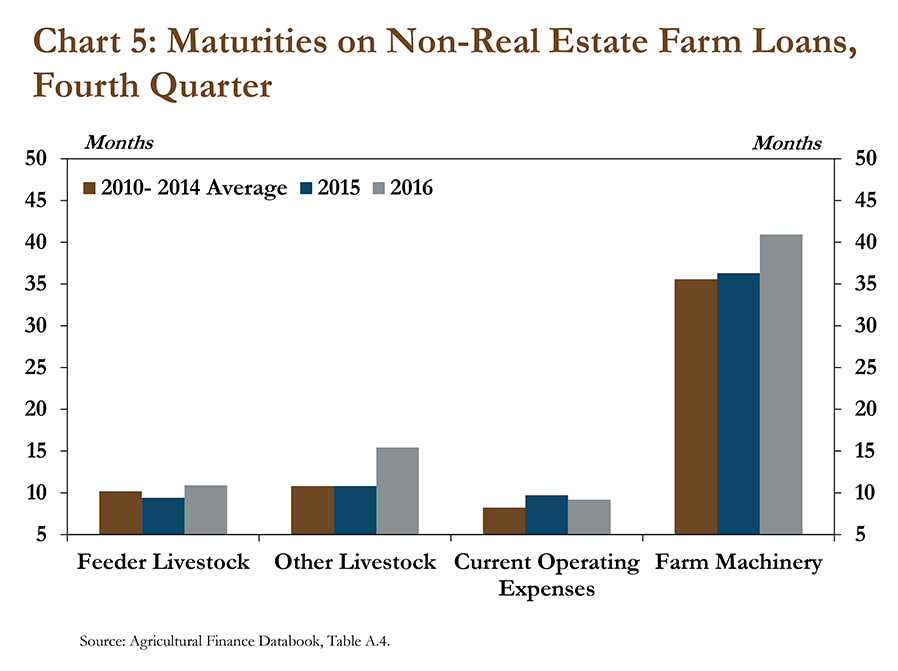
Although expenses declined, profit margins remained tight and bankers responded with further adjustments to loan terms. Bankers extended the maturities for feeder livestock, other livestock and farm machinery loans by 16, 42 and 13 percent, respectively (Chart 5). Longer maturities on intermediate assets may help some producers facing short-term cash flow shortages and also may help banks avoid past-due payments.
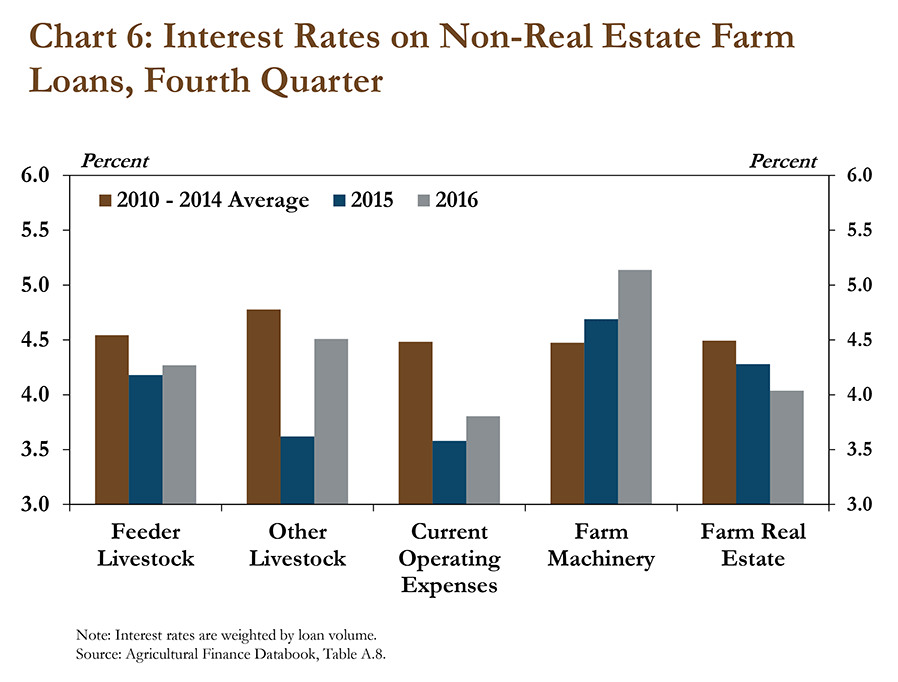
Bankers also raised interest rates in the fourth quarter on all types of non-real estate farm loans. Most notably, interest rates for other livestock and farm machinery increased 0.89 and 0.45 percentage point, respectively (Chart 6). Farm machinery and other livestock carry longer maturity periods and a rate increase may represent a risk-compensation measure when profit margins are tight. Because more than 85 percent of non-real estate loans carried a floating interest rate in the fourth quarter, slight increases in market interest rates may have led to slightly higher interest rates for short-term operating loans in the farm sector. Conversely, interest rates for farm real estate loans edged lower to 4.0 percent in the fourth quarter.
Section B – Third Quarter Call Report Data
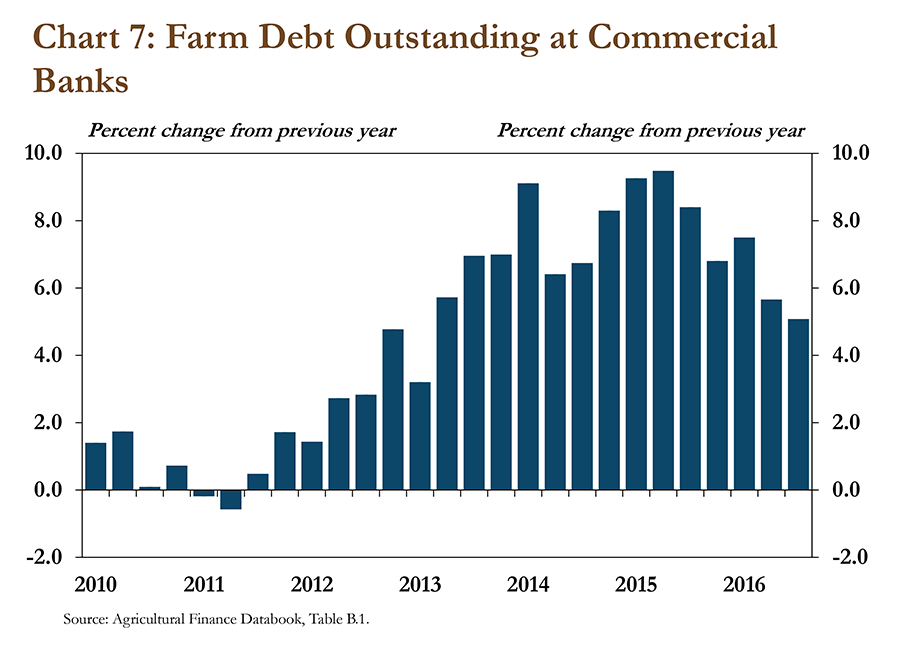
Despite the sharp reduction in new loan originations, outstanding farm-sector debt at commercial banks continued to rise, but at a slower pace. Call Report data indicated outstanding debt increased 5 percent from a year ago (Chart 7). Although the volume of new loans has dropped recently, a slower rate of loan repayments likely has contributed to further increases in the amount of total farm debt outstanding at commercial banks. Nevertheless, the 5-percent increase in outstanding debt was the smallest in more than three years.
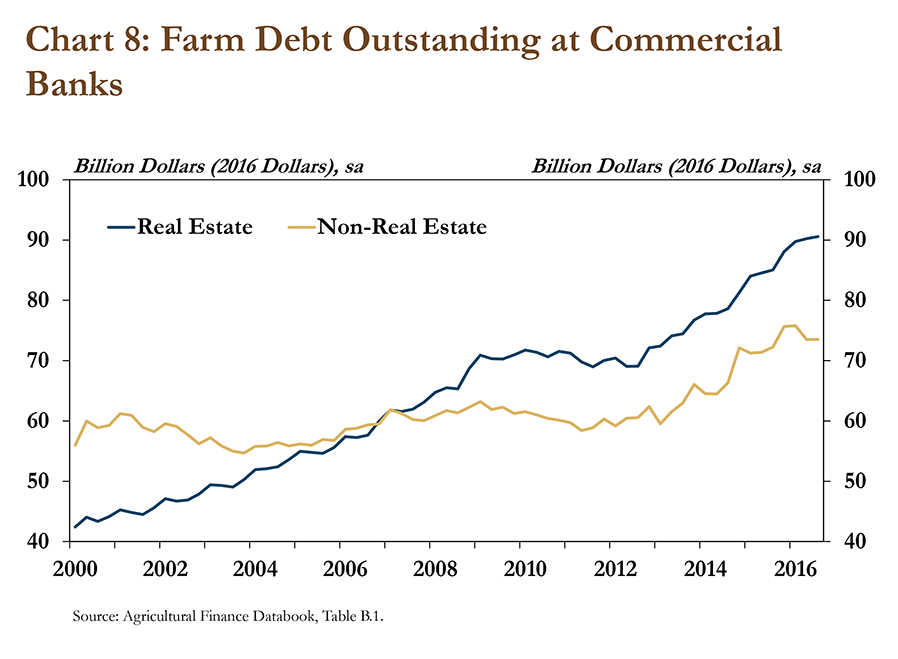
Slower growth in the level of non-real estate farm debt has reduced the overall pace of debt accumulation in the sector. For example, from the third quarter of 2012 to the third quarter of 2015, outstanding debt used to finance non-real estate farm loans grew at an average annual rate of 6 percent following 12 years of growth that averaged less than 0.5 percent (Chart 8). In the third quarter of 2016, however, non-real estate debt grew less than 2 percent from the previous year. Growth in farm real estate debt also slowed slightly in 2016, but has remained relatively steady since 2000.
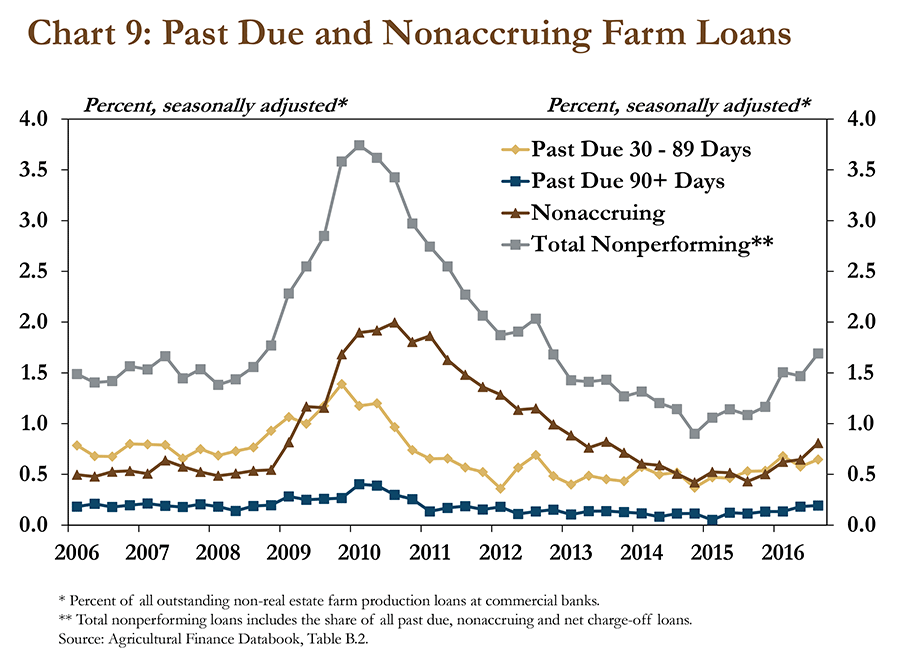
An increase in nonperforming loans may also explain a portion of the slowdown in debt accumulation. In the third quarter, the share of nonperforming loans increased to 1.7 percent from 1.1 percent a year earlier. Although still modest historically, the share of total nonperforming loans in the third quarter was the highest since 2012, and may have caused some lenders and borrowers to moderate their use of debt to prevent further financial stress (Chart 9).
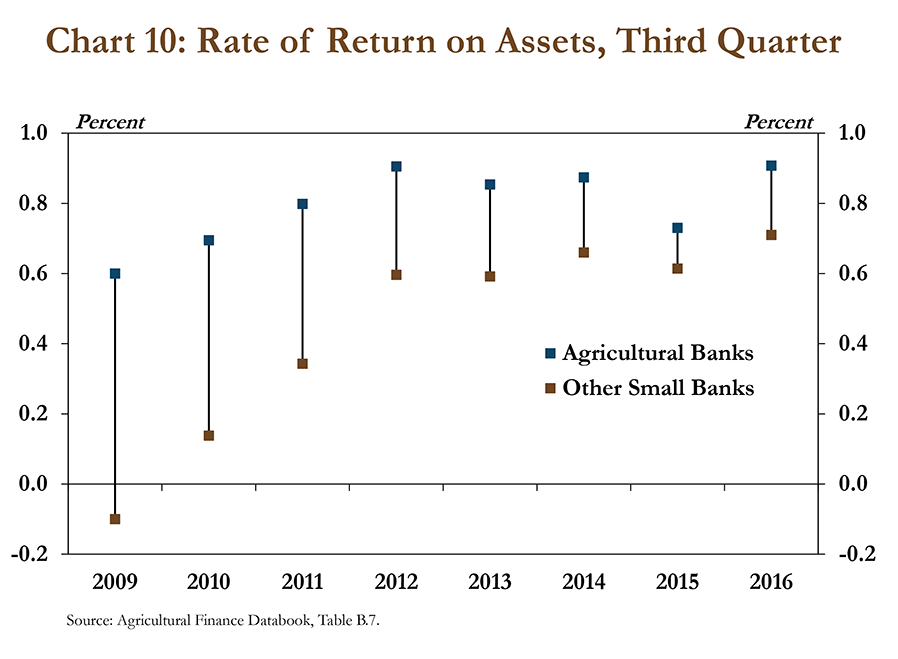
Despite slight increases in nonperforming loans, performance of agricultural banks remained strong. Returns on assets, a typical measure of bank performance, increased to 0.91 percent, the highest third quarter rate of return since 1998 (Chart 10). The loan-to-deposit ratio at agricultural banks also increased to 0.81 percent, the highest since the third quarter of 2009.
Section C – Third Quarter Regional Agricultural Data
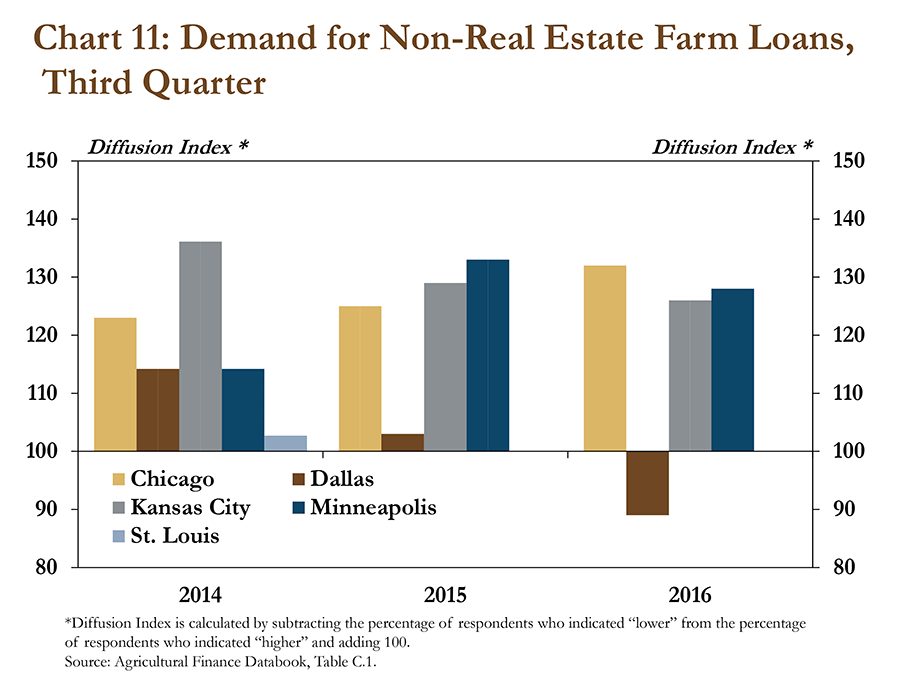
Regional Federal Reserve surveys also showed that demand for non-real estate financing in the farm sector increased, but not as strongly as in recent years. According to the surveys, demand for non-real estate loans increased in the Chicago, Kansas City and Minneapolis districts in the third quarter. However, growth was slower in Kansas City and Minneapolis than in 2015 (Chart 11). Additionally, demand for non-real estate financing in the third quarter declined in the Dallas district for the first time since 2013 and was unchanged in the St. Louis district for the second consecutive year.
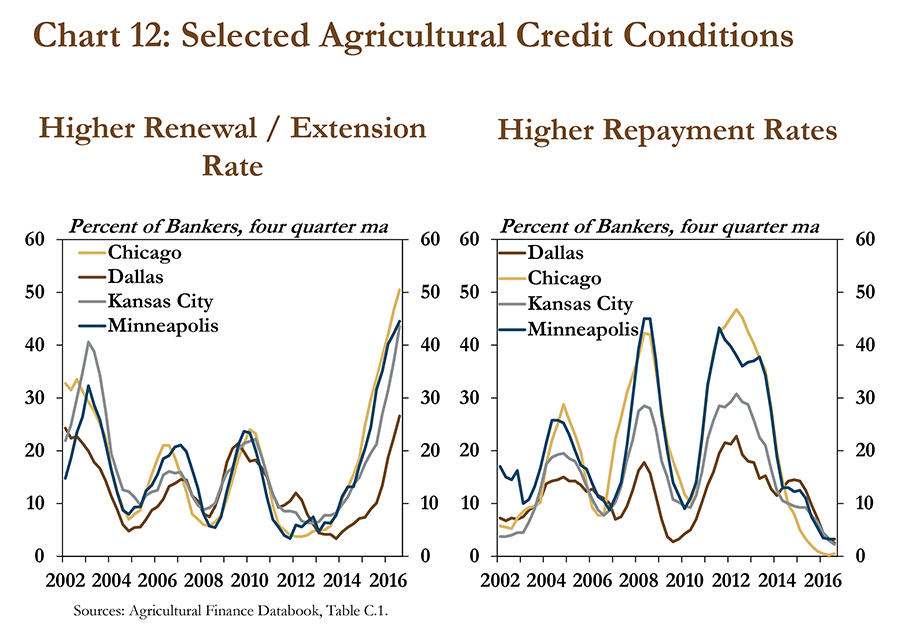
In addition to loan demand, demand for loan renewals and extensions also has continued to rise. The share of bankers that reported an increase in loan renewals and extensions was the highest in survey history for the Chicago, Kansas City, Minneapolis and St. Louis districts and the highest since 2001 in the Dallas district (Chart 12). Conversely, the share of bankers that reported higher repayment rates was at, or near, historical lows for the Chicago, Dallas, Minneapolis and St. Louis districts and the lowest since 1999 in the Kansas City District. Elevated demand for loan renewals and extensions and weaker repayment rates underscored a growing sense of financial stress in the farm sector.
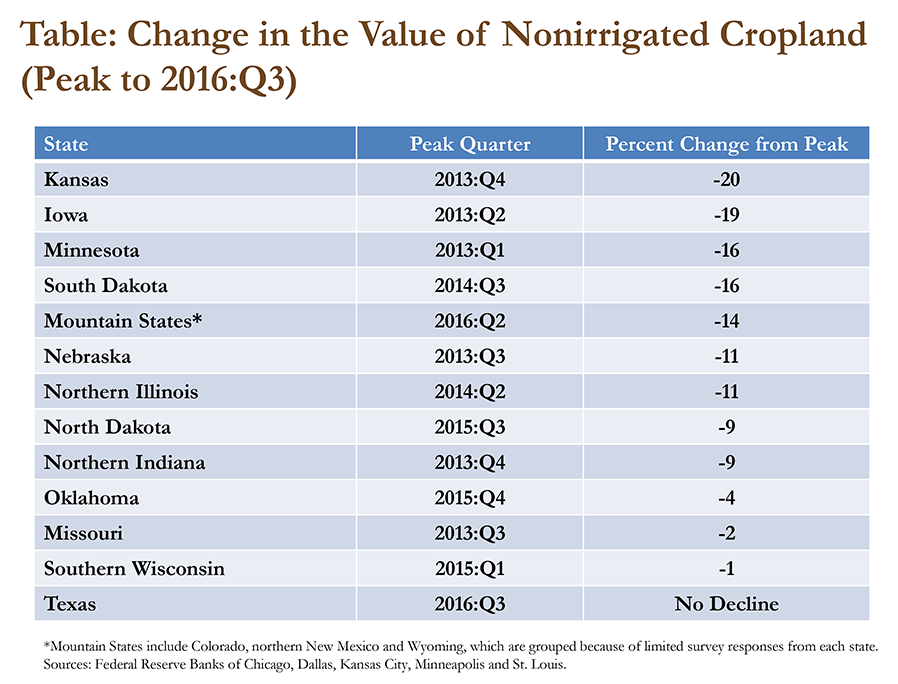
Prolonged financial stress in the farm sector also has continued to curb farm real estate values. In fact, farmland values in all states in the Chicago, Kansas City and Minneapolis districts have declined from their recent peaks (Table). Most notably, nonirrigated cropland values have dropped by 20 percent, on average, in Kansas and 19 percent in Iowa since 2013. Although, this represents an annualized rate of only 5-8 percent, persistent and gradual declines could lead to further financial stress in the farm sector in the coming years.
Conclusion
A gradual increase in the level of financial stress in the farm sector has caused agricultural lenders and borrowers to become increasingly cautious. Although declines in the cost of some key inputs have provided modest relief, profit margins have remained low and new farm loan originations dropped sharply in the fourth quarter. If profit margins remain low through 2017, the pace of new debt will be a key indicator to monitor in assessing the severity of financial stress through the year.
____________________________________________
i Data calculated from the United States Department of Agriculture – Economic Research Service, Commodity Costs and Returns division, “Cost-of-Production Forecasts” available at https://www.ers.usda.gov/data-products/commodity-costs-and-returns/commodity-costs-and-returns/#Cost-of-Production Forecasts
The views expressed are those of the authors and do not necessarily reflect the positions of the Federal Reserve Bank of Kansas City or the Federal Reserve System.
Author
