Farmland values continued to increase at a rapid pace through the end of 2021. Alongside sustained strength in farm income and credit conditions, the value of all types of farmland in the Tenth District was more than 20% higher than a year ago. The recent strength in agricultural real estate markets has been supported by strong demand, historically low interest rates and vastly improved conditions in the farm economy.
Lenders reported a mostly favorable outlook for agriculture in the District but cited the rise in input costs as a risk to the sector. Even with uncertainty around input costs, lenders expected favorable conditions in the economy to support farm finances and lead to further gains in farmland values in 2022. The possibility of weaker agricultural income and higher interest rates in the economy remain as risks for farmland markets. Despite the risks, the agricultural sector appears to be well positioned for the year ahead, supported by strong balance sheets, high agricultural commodity prices and sharp gains in farmland values.
Section 1: Farm Income and Credit Conditions
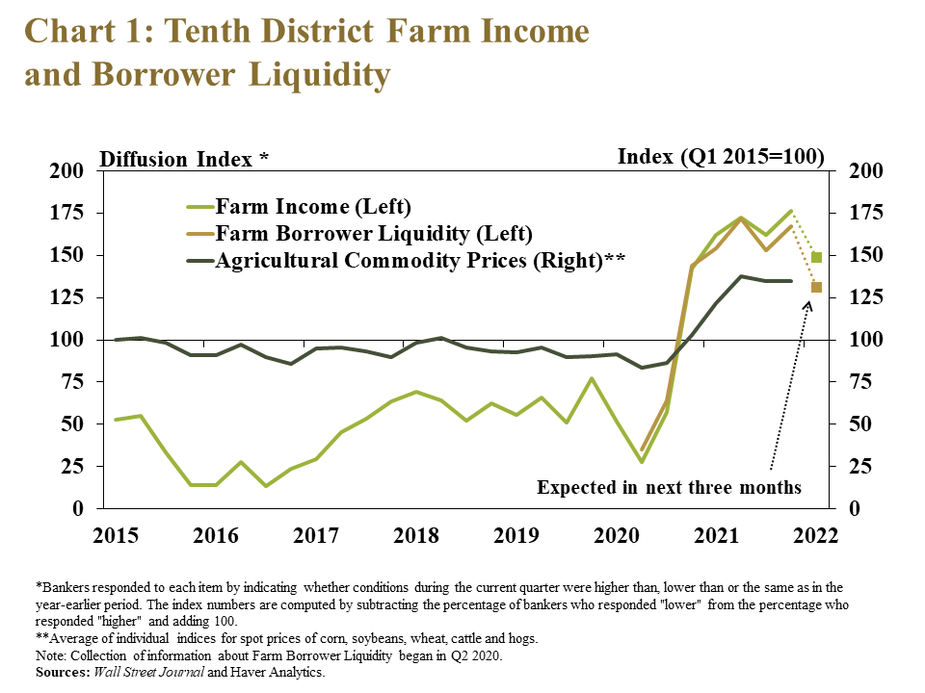
Strength in the agricultural economy continued to support farm income and borrower liquidity through the end of 2021. Profit opportunities remained strong alongside elevated commodity prices, and both farm income and borrower liquidity increased from a year ago at a pace similar to recent quarters (Chart 1). Farm finances were expected to remain strong in the coming months, but improve at a slower pace.
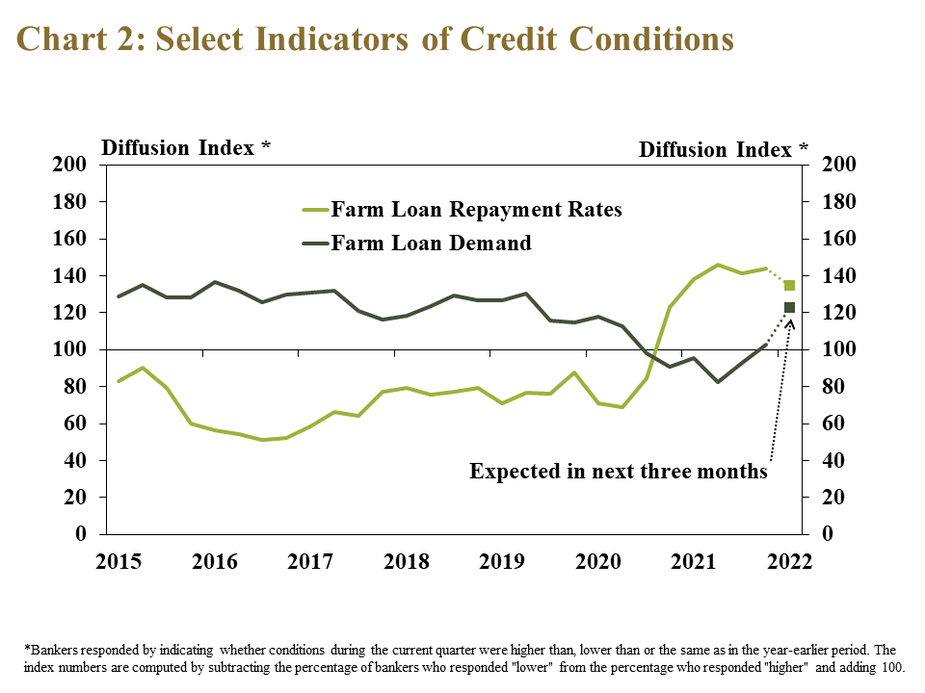
Alongside strong farm finances, loan repayment rates continued to increase and demand for agricultural loans remained subdued. Similar to recent quarters, nearly half of respondents reported that farm loan repayment rates were higher than a year ago and only a fraction reported repayment was slower (Chart 2).
Demand for farm loans was nearly unchanged from a year ago throughout the region but, alongside the recent rise in production expenses, demand was expected to increase in coming months.
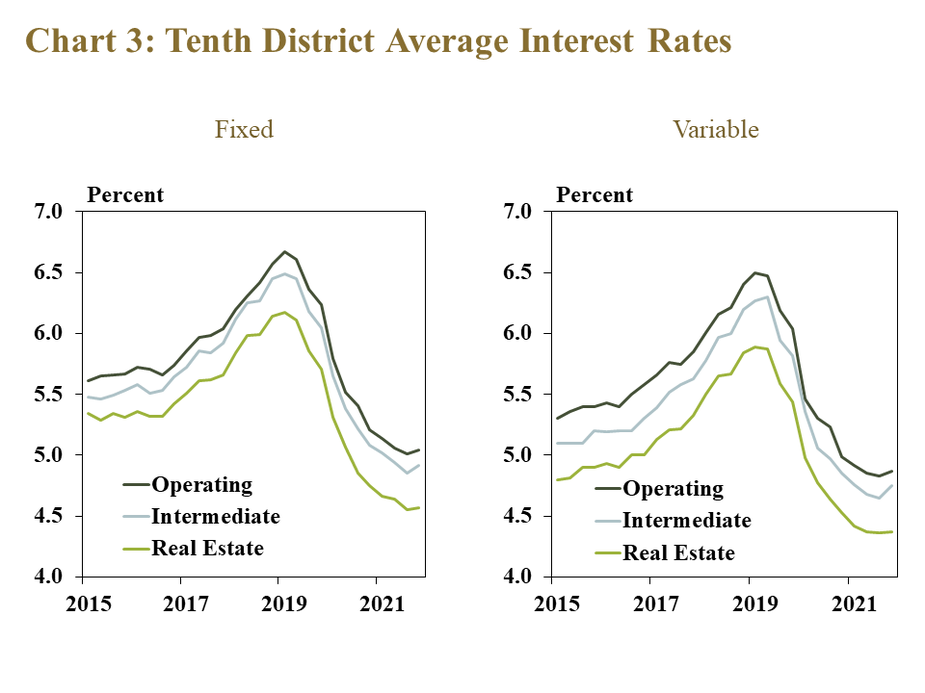
Interest rates on farm loans increased slightly from the previous quarter, but remained historically low. The average rate charged on all types of loans increased from the previous quarter for the first time since early 2019 (Chart 3). Rates on all loan types were an average of 5 basis points higher than the previous quarter, but remained around 100 basis points below the average from 2015 to 2019.
Section 2: Farm Real Estate
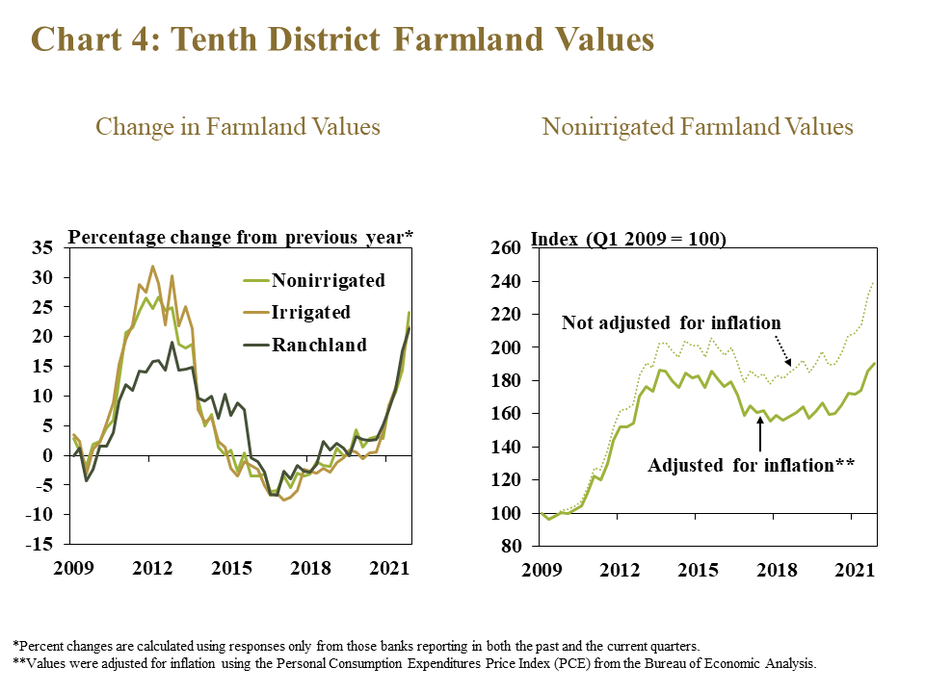
Together with historically low interest rates and strong agricultural credit conditions, farmland values rose rapidly, according to respondents. Farm real estate values rose more than 20% from a year ago, the highest increase among recent quarters (Chart 4, left panel). The strong growth pushed the average value of nonirrigated cropland to record levels even after adjusting for inflation (Chart 4, right panel).
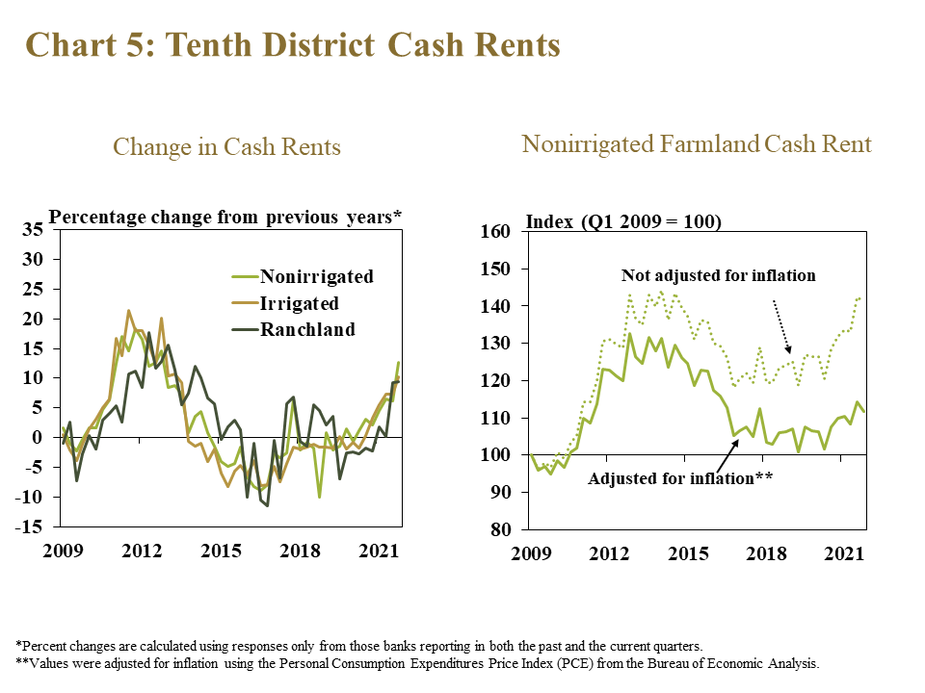
Cash rents continued to increase alongside farmland values, but at a slower pace. Cash rents for all land types increased by about 10%, a faster pace than previous quarters but about half of the increase in farmland values (Chart 5, left panel). After adjusting for inflation, cash rents on nonirrigated cropland remained about 15% below the historic high reached around 2012 (Chart 5, right panel).
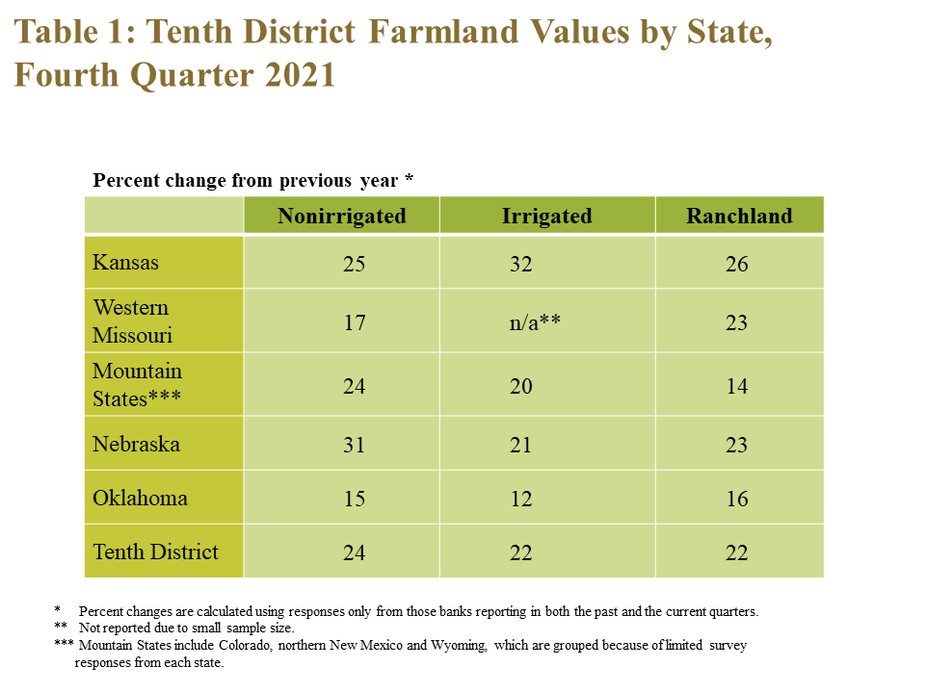
The sharp increase in farmland values was consistent across all states and land types throughout the District. The value of nonirrigated cropland and irrigated cropland increased notably in Nebraska and Kansas, respectively (Table 1). Oklahoma, however, faced the slowest increase in values across all land types.
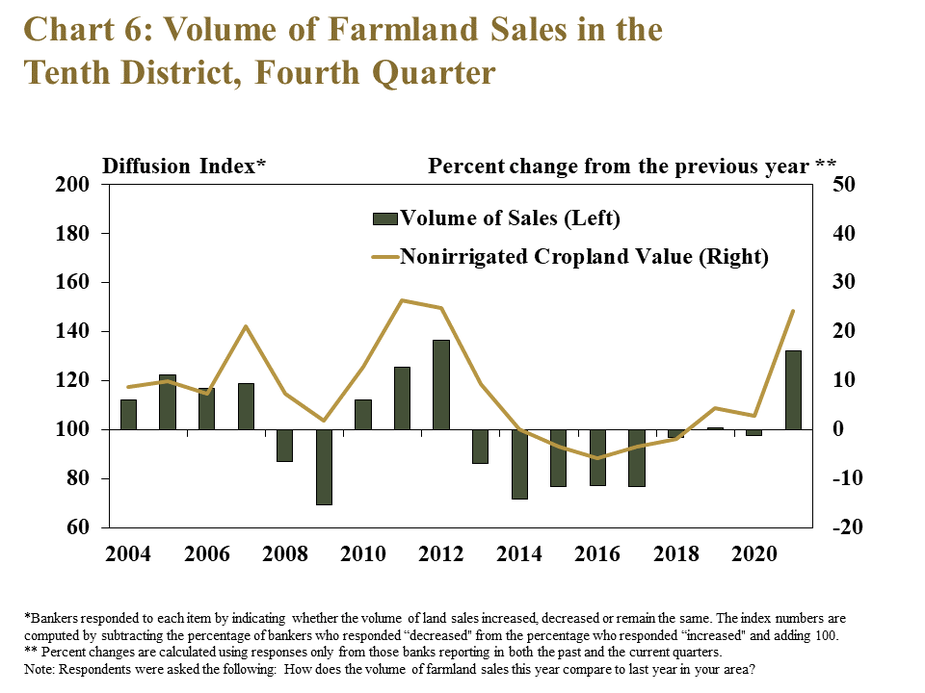
Farmland sales also increased alongside the surge in farmland prices. About 45% of bankers reported that the volume of farmland sales was higher than a year ago, the largest share since 2012 (Chart 6). Some contacts suggested that potential changes in tax policy led to an increase in sales. Nevertheless, a similar boom in sales also occurred during the last period of strong agricultural conditions from 2010 to 2012.
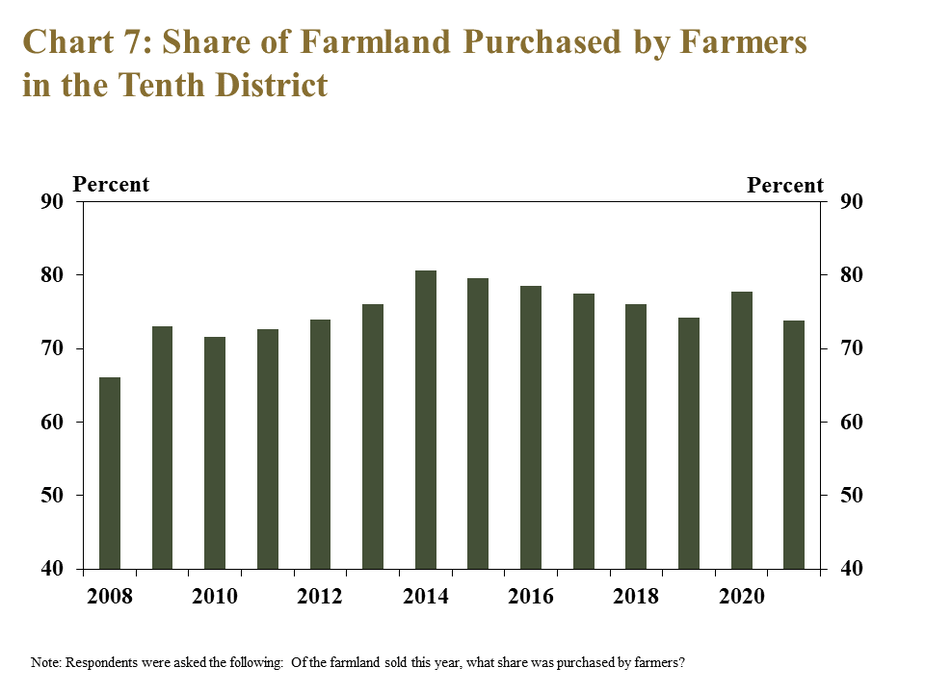
Despite a higher volume of sales, farmers accounted for a smaller share of the total farmland purchased in the District. Farmers still accounted for more than 70% of farmland purchases in 2021, but unlike the prior period of strengthening farm income immediately after 2010, the share of land purchased by farmers declined slightly (Chart 7). The modest pullback in purchasing activity from farmers alongside broad strength in the agricultural economy suggests strong interest in farmland from non-farmers and outside investors.
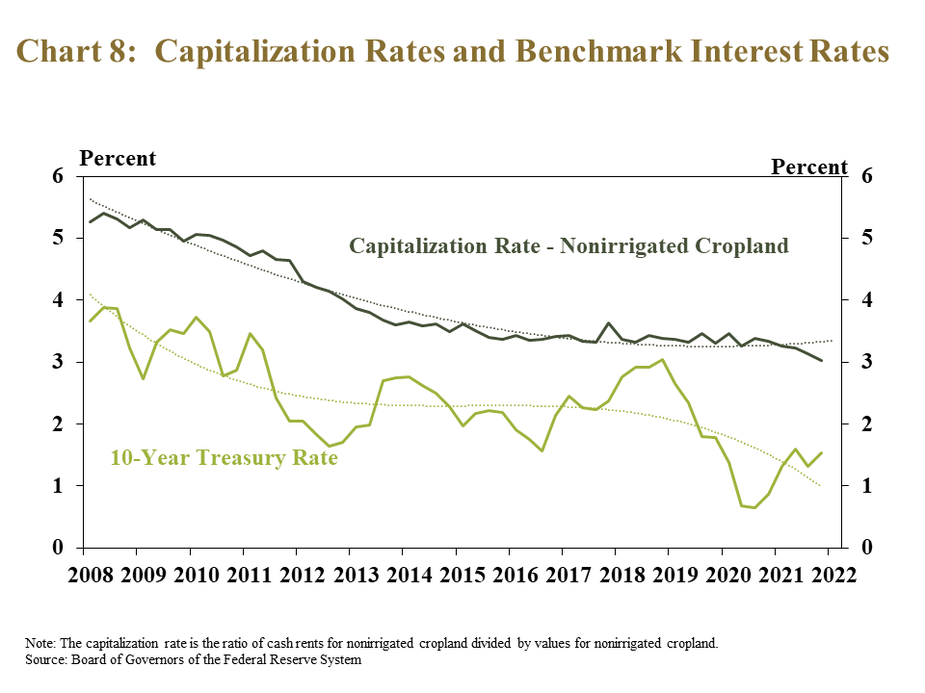
Even with a lower rate of return than previous years, farmland ownership remained an attractive investment compared with low-risk assets. The ratio of cash rents to land values in the region, or capitalization rate, declined to a historic low in 2021, suggesting landowners were receiving lower returns on investments in farmland (Chart 8). Despite the contraction, returns in other low-risk markets, such as the 10-year U.S. Treasury, remained even lower, making farmland ownership a potentially attractive investment.
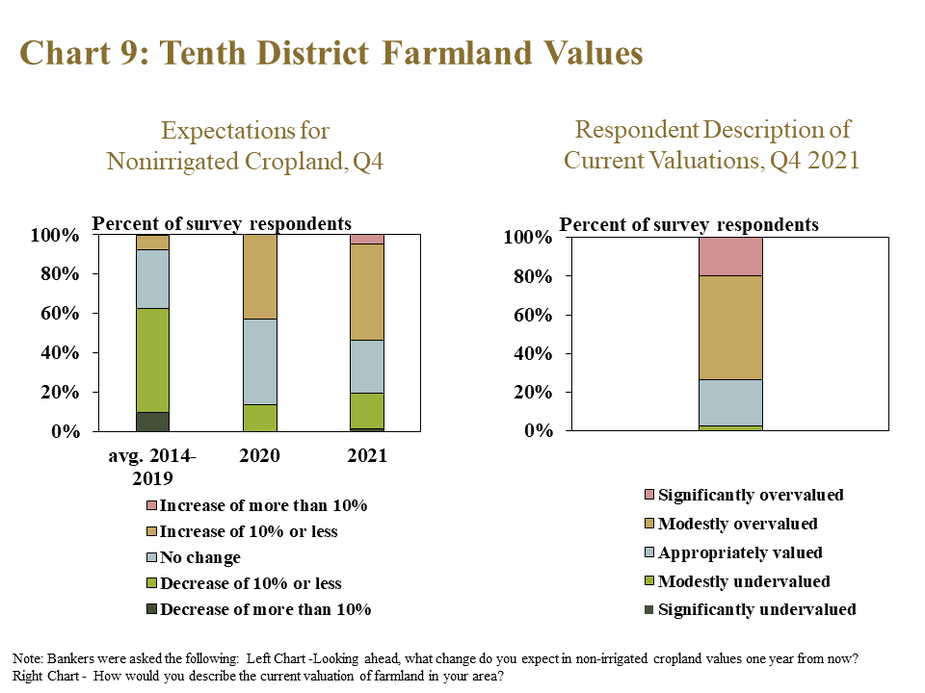
Looking ahead, most bankers expected further increases in farmland values during the next year. More than 50% of respondents expected farmland values to increase in 2022, up from less than 45% in 2020, and less than the average of 10% from 2014 to 2019 (Chart 9). On top of expectations of higher farmland values for the next year, more than 50% of respondents also indicated that farmland values were currently overvalued, suggesting there may still be future risks of declines.
Fourth Quarter 2021 Banker Comments from the Tenth District
“Input costs may become too high for the average farmer to pay for and should this occur, crop production will decrease.” – Southeast Colorado
“Severe drought is causing very high feed prices and many producers have reduced cow herds and are just maintaining the core herd.” – Northeast Wyoming
“Another dry year in our trade area and producers are having to buy a lot of high-priced feed or ship cattle to feedlots 200-400 miles away for the winter.” – Northern Wyoming
“Input cost and equipment replacement cost have skyrocketed and even if commodity prices are higher, net income could be reduced or crop production could drop due to costly fertilizer and chemicals.” – Northwest Oklahoma
“Many land purchases in this area have been related to the expansion of the marijuana business in Oklahoma. Small tracts of land are nearly impossible to find, and are very overpriced.” – Southeast Oklahoma
“The combination of highly increased grain prices, modest production costs in 2021, exceptional local crop yields and strong liquidity from COVID related programs has created ag wealth improvement beyond any I have seen in my ag banking experience of over 40 years and resulted in massive appreciation in farm assets.” – Northeast Kansas
“Higher commodity prices have resulted in good earnings and increases in working capital positions, but there are concerns for extended drought, and high input costs.” – Southwest Kansas
“We have seen increased pricing for fertilizer, chemical, fuel and seed; but currently, higher livestock and grain prices have benefited producers in our area.” – Central Kansas
“Overall crop input costs are becoming more of a concern, as well as availability of some inputs such as nitrogen fertilizers and availability of some parts for equipment repair is also a concern. Greater fertilizer cost has some producers converting corn acres to soybeans.” – Central Missouri
“There is a lot of liquidity in banks and among the general public around here and smaller land tracts have shown a significant increase in auction sale prices. No large tracts have sold lately, but I would anticipate higher sale prices on larger tracts also” – Southcentral Missouri
“Low interest rates, strong crop yields in 2021 and higher grain prices have supported conditions and higher real-estate prices.” – Southeast Nebraska
“Input cost for grain production, mainly fertilizer and herbicides will significantly increase break even prices for grain farmers.” – Central Nebraska
Data Files: Credit Conditions | Fixed Interest Rates | Variable Interest Rates | Land Values
A total of 154 banks responded to the Fourth Quarter Survey of Agricultural Credit Conditions in the Tenth Federal Reserve District—an area that includes Colorado, Kansas, Nebraska, Oklahoma, Wyoming, the northern half of New Mexico and the western third of Missouri. Please refer questions to Nathan Kauffman, economist or Ty Kreitman, assistant economist at 1-800-333-1040.
The views expressed in this article are those of the authors and do not necessarily reflect the views of the Federal Reserve Bank of Kansas City or the Federal Reserve System.
Authors

Francisco Scott
Senior Economist
