Agricultural credit conditions in the Tenth District remained strong in the third quarter and farm real estate values increased sharply. Farm income and loan repayment rates continued to increase at a steady pace and contributed to multi-year lows in problem loans and asset liquidation. While conditions have improved substantially from recent years throughout the region, the pace of increase in farm income and loan repayment rates was slower in areas most significantly impacted by drought. Alongside a strong agricultural economy and historically low interest rates, the value of all types of farmland was about 15% higher than a year ago.
Most lenders have remained optimistic about the outlook for agriculture in the District but have expressed concerns about rising input costs. Despite rising costs, however, elevated commodity prices have continued to support farm finances, particularly for crop producers. Though many risks remain, the agricultural sector will be well positioned heading into 2022 alongside the persistent strength in commodity prices and double-digit gains in land values.
Section 1: Farm Income and Credit Conditions
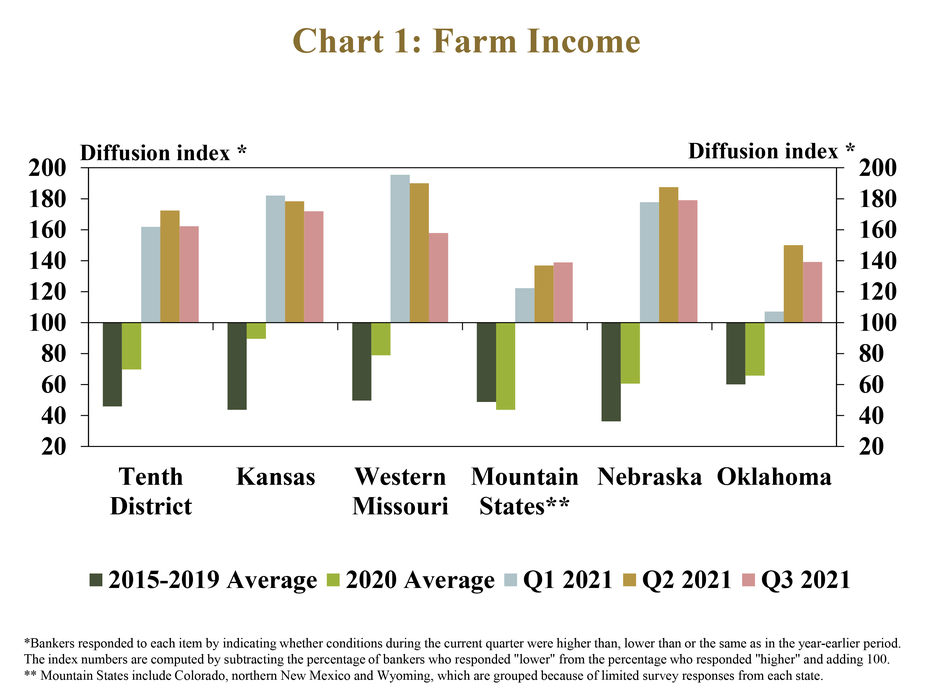
A strong agricultural economy continued to support increases in farm income and spending through the third quarter. More than half of banks in the District reported income was higher than a year ago for the fourth consecutive quarter (Chart 1). Farm income was higher across all states, but the rate of increase remained slower in Oklahoma and the Mountain States.
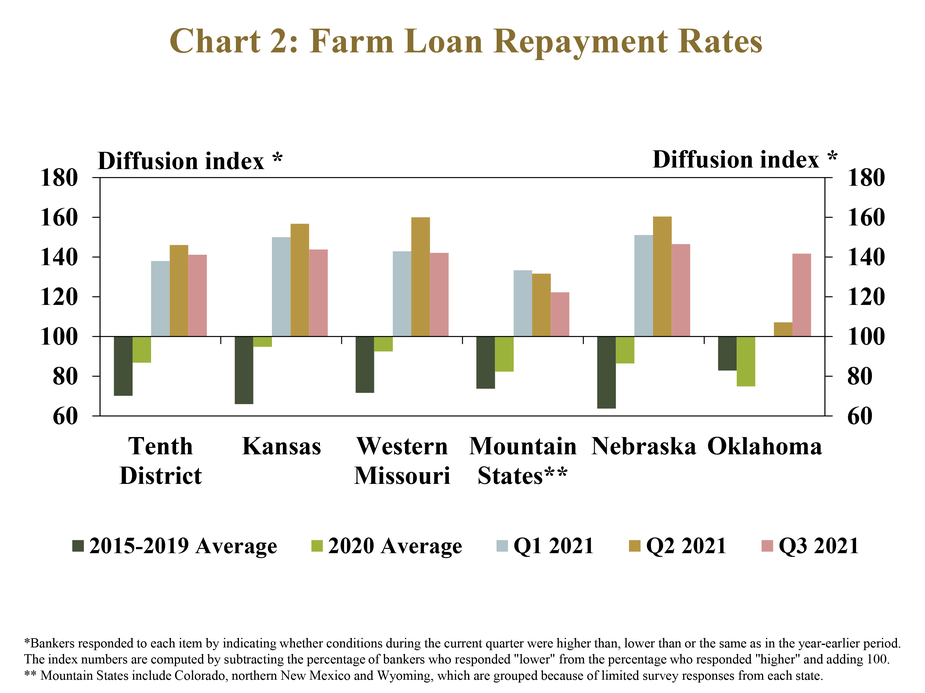
The improvement in farm finances drove further increases in loan repayment rates. About 40% of banks reported that farm loan repayment rates were higher than a year ago for the third consecutive quarter (Chart 2). Similar to farm income, repayment also improved in all states; but the pace of increase was slightly slower in the Mountain States.
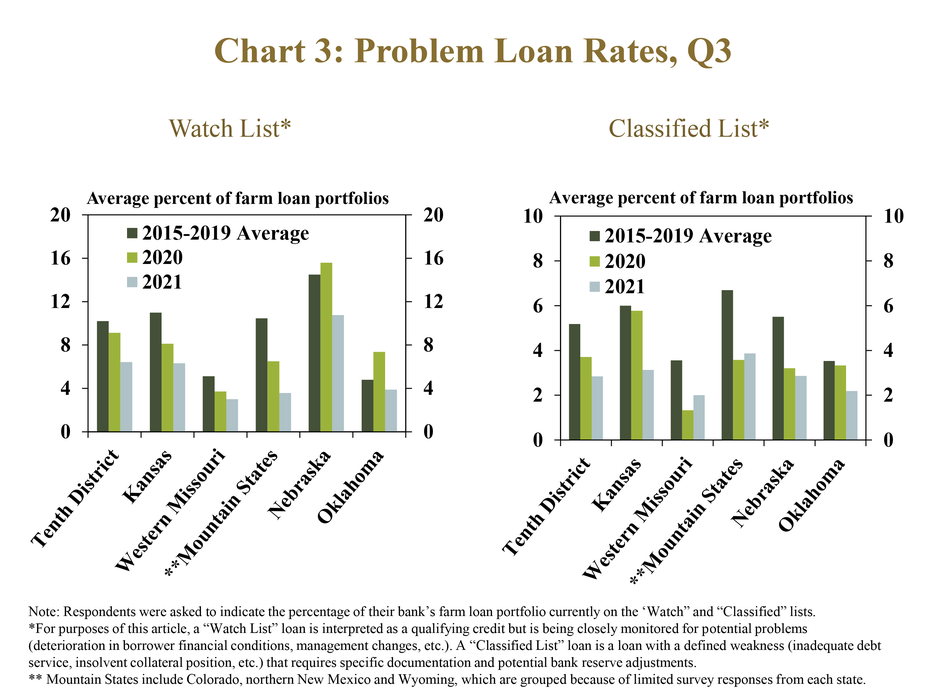
Alongside broad improvement in loan performance, problem loan rates remained at multi-year lows throughout the region. The average share of farm loans on internal watch lists declined for the second year in a row in all states (Chart 3, left panel). The portion of loans considered classified also remained well below the average of recent years and declined in most states from a year ago (Chart 3, right panel).
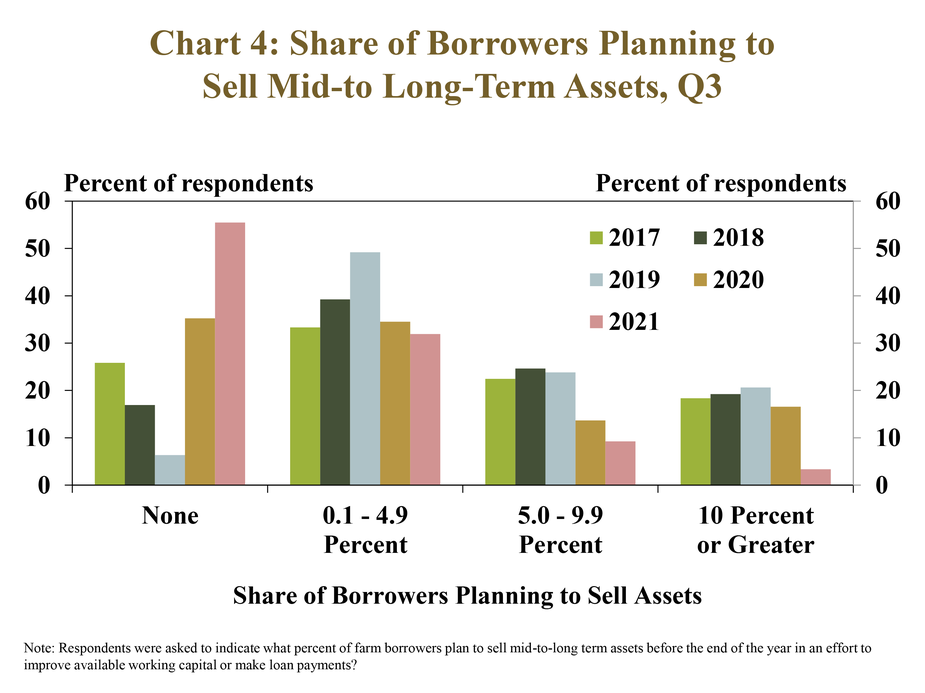
Stronger farm borrower financials also drove a sharp reduction in asset liquidation. More than half of respondents expected none of their farm borrowers to sell assets to improve working capital (Chart 4). Another third of lenders reported that less than 5% of borrowers planned to sell assets. The low prevalence of liquidation among borrowers was a swift turnaround from recent years when a small, but notable, number of borrowers had begun to sell assets to improve liquidity.
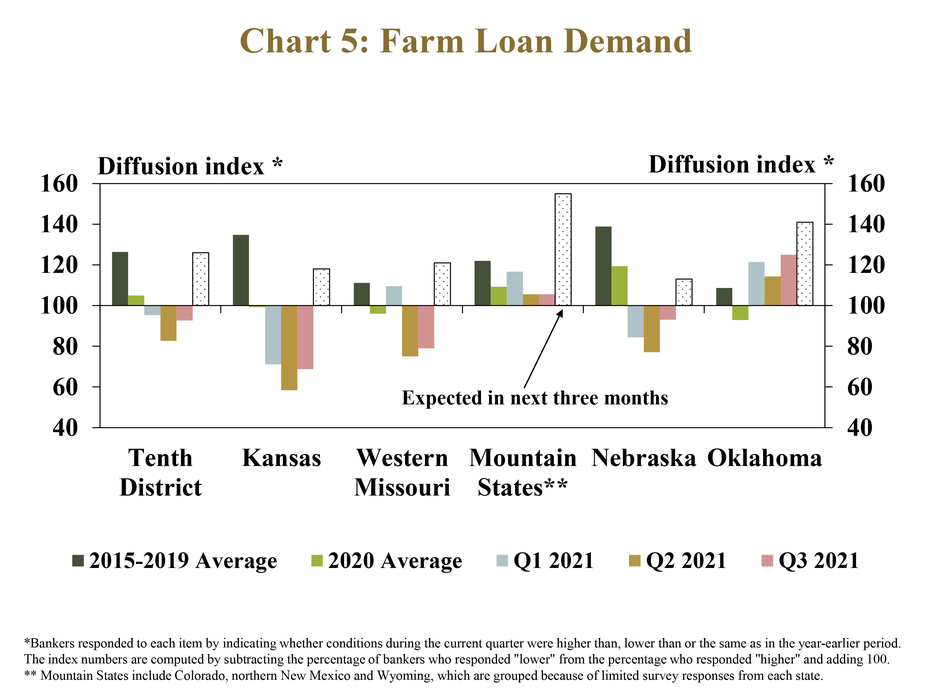
Credit demand remained subdued alongside recent strength in farm income, but was expected to grow in coming months. Demand for farm loans was less than a year ago in most states, but was slightly higher in Oklahoma and the Mountain States (Chart 5). Respondents continued to comment about rises in input costs that could increase credit needs, and loan demand was expected to increase across all District states in the coming months.
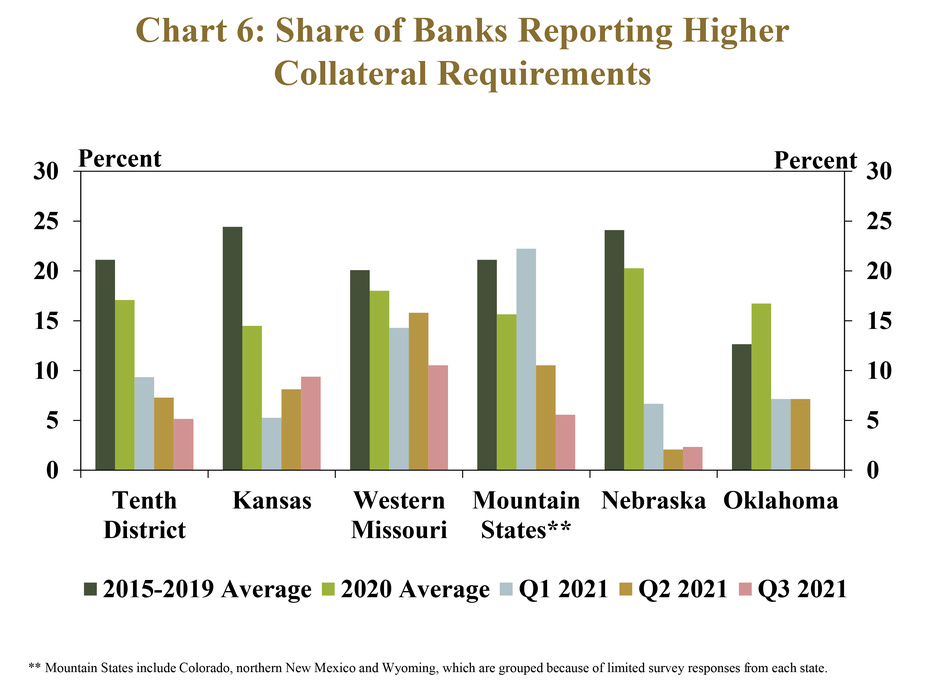
Despite the outlook for higher production costs, lending standards stabilized alongside ample funding and stronger credit conditions. Following several years of tightening, only about 5% of banks indicated that collateral requirements were higher than a year ago (Chart 6). While no banks reported loosening of standards, tightening has eased over the past year in all states throughout the District.
Section 2: Drought and Credit Conditions
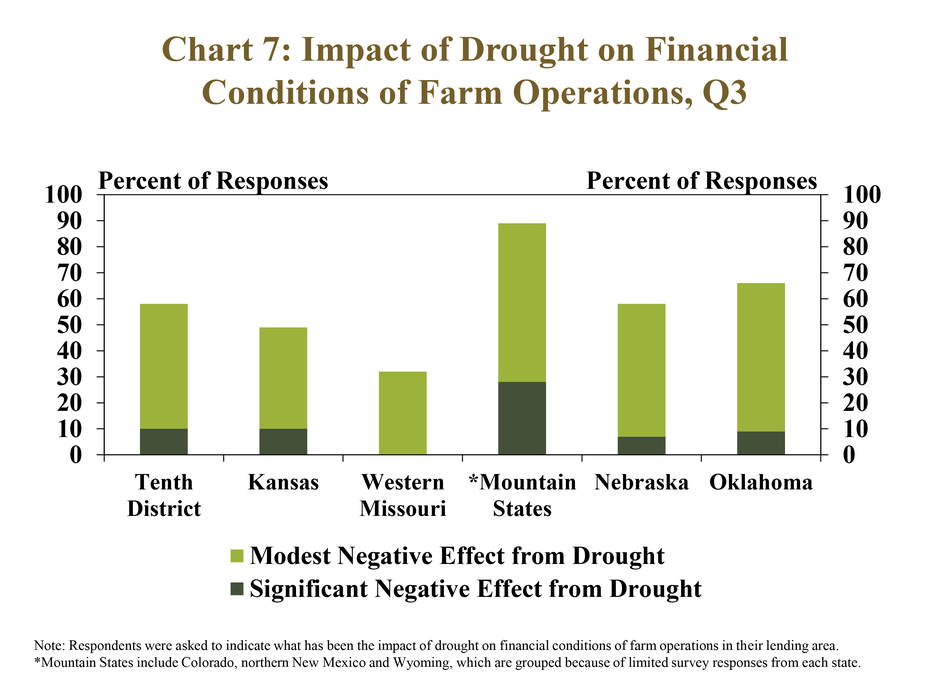
The financial impact of drought remained a key concern for banks in some portions of the District. In fact, the ongoing drought had a negative impact on financial conditions for borrowers at nearly 60% of banks (Chart 7). The effect was most severe in the Mountains states, where a large majority reported a negative impact and about 30% described the pressure on farm finances as significant.
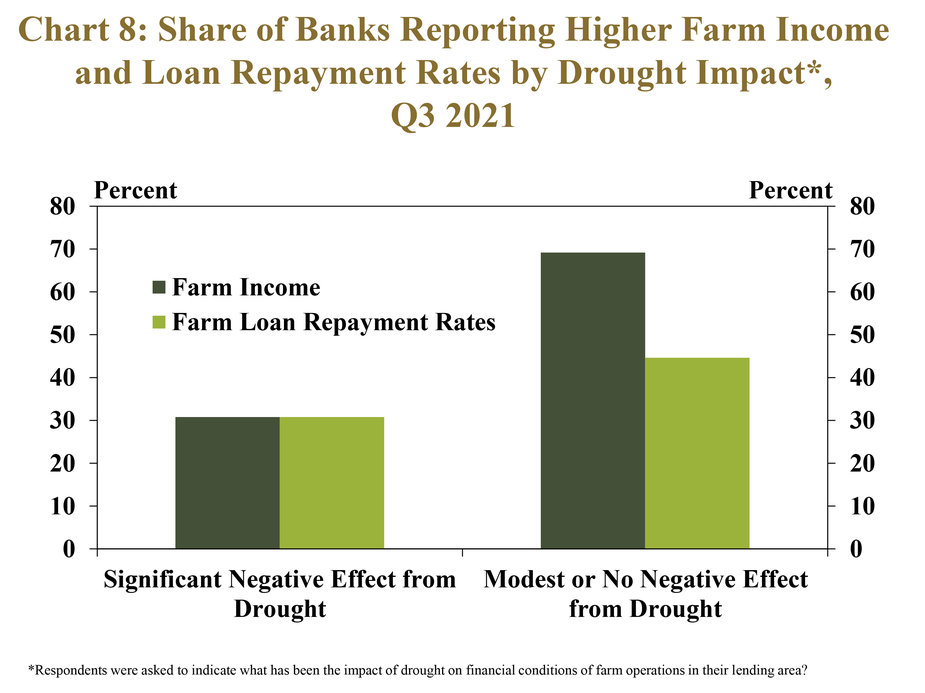
Lenders in areas most impacted by drought reported slower improvement in farm income and credit conditions. Only about 30% of banks that described the impact of drought as significant reported farm income and loan repayment rates were higher than a year ago (Chart 8). In comparison, about 70% of all other banks reported an increase in farm income and about 45% reported higher repayment rates.
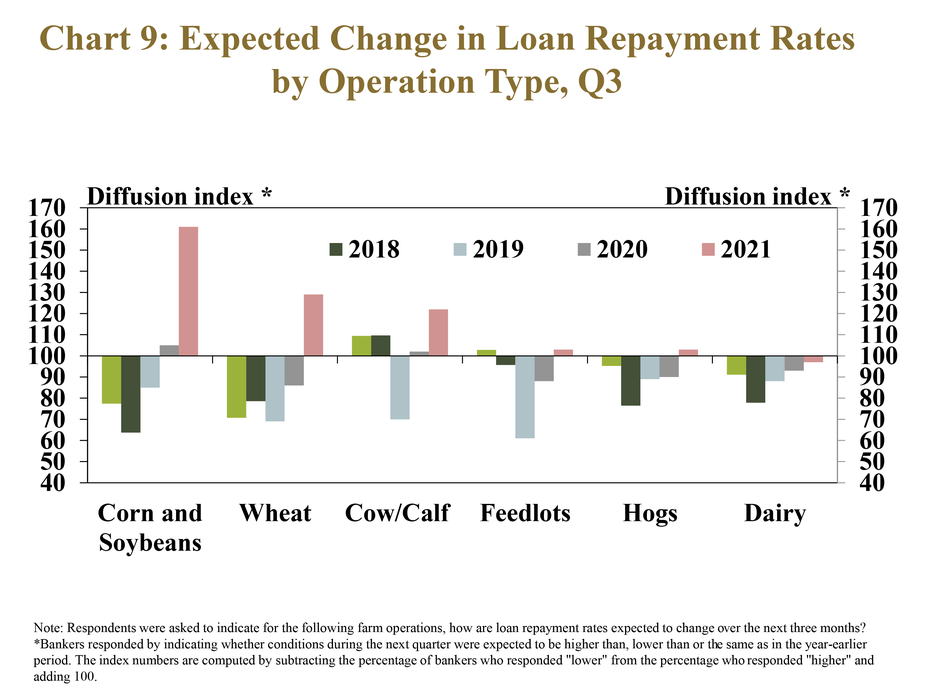
In addition to weaker conditions in areas affected by drought, credit conditions for livestock and dairy producers throughout the region also were expected to improve at a slower pace through the end of 2021. About 60% of respondents expected repayment rates for corn and soybean operations to increase in the next quarter (Chart 9). Only about half as many respondents anticipated improvement for wheat and cow-calf producers and even fewer thought conditions would improve for feedlot, hog and dairy operations.
Section 3: Farmland Values and Interest Rates
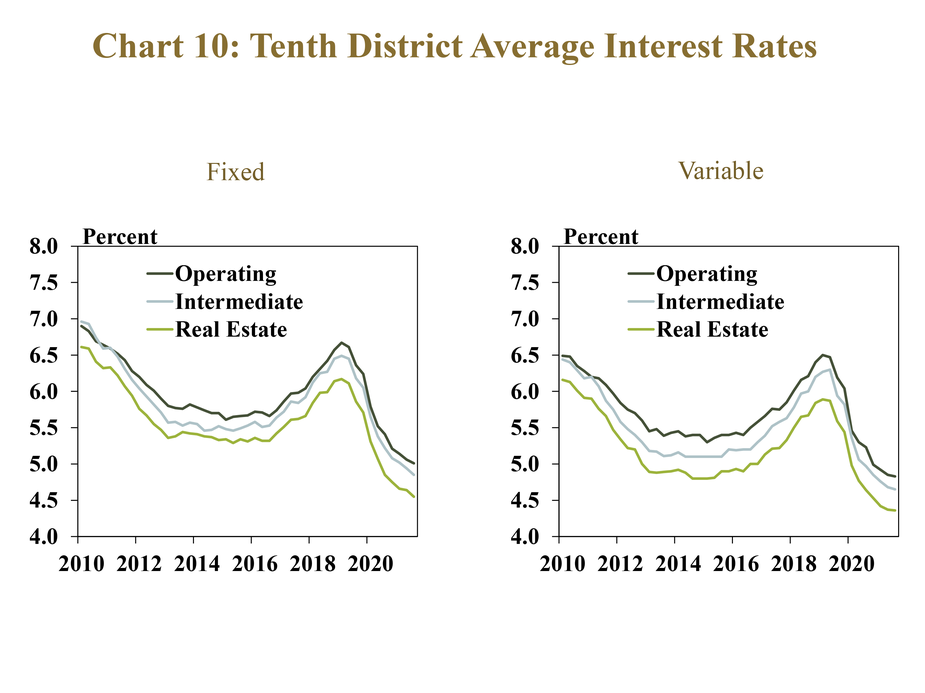
Interest rates on farm loans remained historically low alongside benchmark rates. The average fixed rate on all loan types edged slightly lower than the previous quarter and reached another all-time low (Chart 10). While the change was modest, average variable rates on all loan types also declined from the previous quarter and remained at all-time lows.
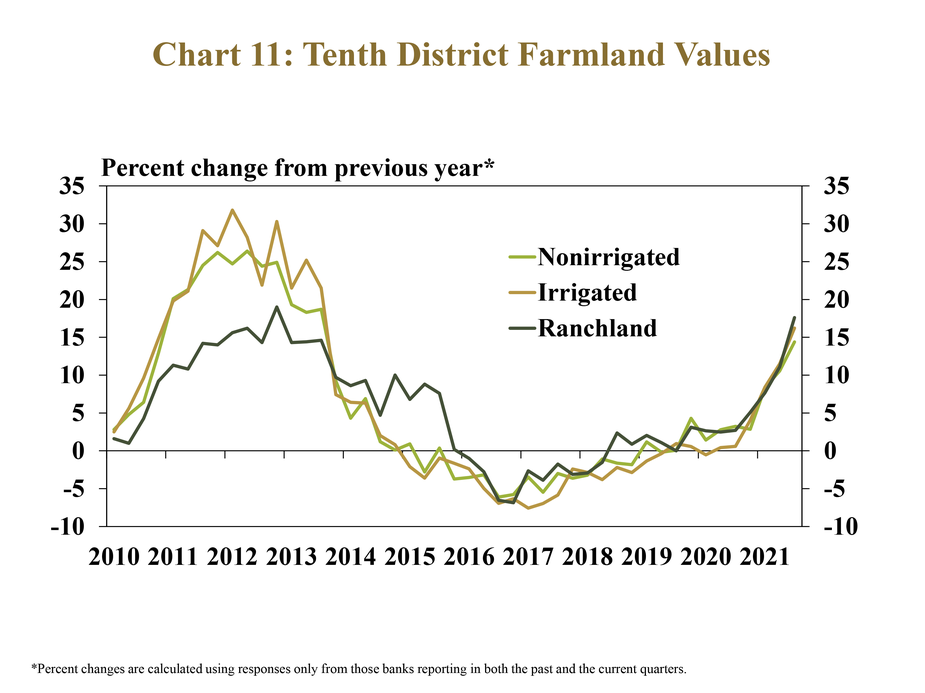
With support from a strong farm economy and historically low interest rates, farmland values in the region increased sharply. Nonirrigated cropland values were about 15% higher than a year ago, the largest increase since 2013 (Chart 11). Irrigated cropland and ranchland values increased slightly more than 15%, which was also the largest increase since 2013.
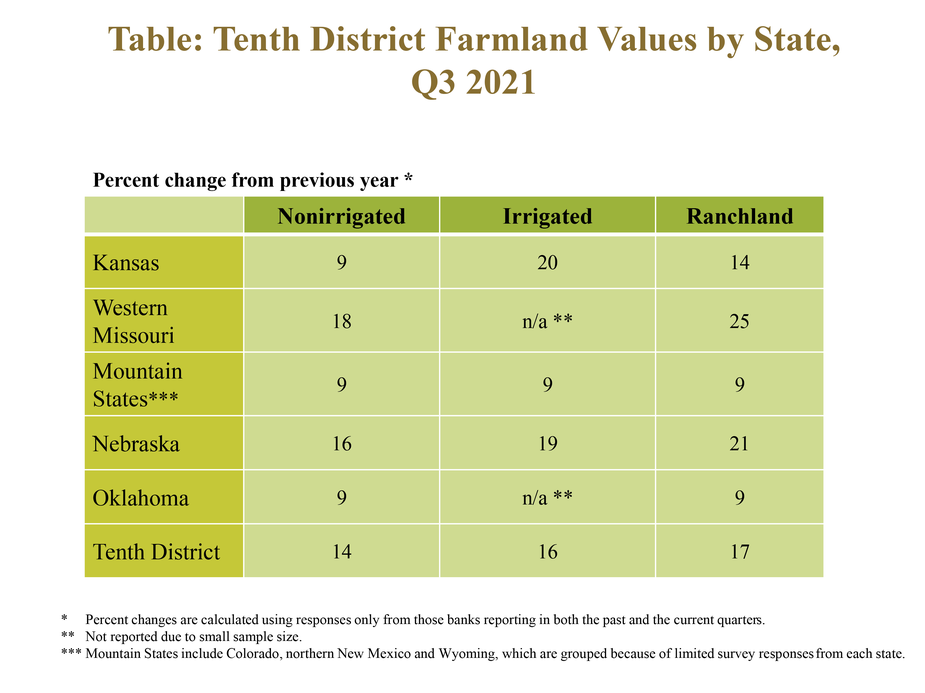
The strength in farm real estate values was consistent across all states in the District. Nonirrigated cropland increased more than 15% in western Missouri and Nebraska and slightly less than 10% in all other states (Table). The appreciation of Ranchland was also most pronounced in western Missouri and Nebraska, while irrigated land values increased at the fastest pace in Kansas and Nebraska.
Third Quarter 2021 Banker Comments from the Tenth District
“Some primary concerns in our area are higher input costs, recurring drought and issues surrounding irrigation water” – Southeast Colorado
“The economic recovery has driven up prices of farm ground and housing” – Southern Colorado
“Drought has had a high impact in our area and feed prices are skyrocketing. Grass and water availability are big concerns, and some areas will see some herd liquidation.” – Northern Wyoming
“We are most concerned about a change in interest rates and higher input costs.” – Northern Wyoming
“Good access to water has limited the impact of drought in our area, although hay prices have skyrocketed.” – Central Wyoming
“Higher input costs and limited oil activity are concerns in our area.” – Northwest Oklahoma
“The ag lending environment is strong in southwest Oklahoma and crop production this year has been above average.” – Southwest Oklahoma
“Cost of inputs have soared higher and there is concern that grain prices will come down if global supplies increase.” – Southwest Kansas
“Our concerns include significant increases in input costs and availability of equipment and parts.” – Southcentral Kansas
“Land prices will continue to be strong with limited supply and established farmers will have money to spend.” – Northwest Missouri
“Borrowers are repaying ahead of schedule, but pastures could begin running short as rainfall has become very short recently.” – Central Missouri
“Land sales have seen an increasing value due to higher commodity prices and demand.” – Northeast Nebraska
“Our area has been impacted by severe drought.” – Southwest Nebraska
Data Files: Credit Conditions | Fixed Interest Rates | Variable Interest Rates | Land Values
A total of 136 banks responded to the Third Quarter Survey of Agricultural Credit Conditions in the Tenth Federal Reserve District—an area that includes Colorado, Kansas, Nebraska, Oklahoma, Wyoming, the northern half of New Mexico and the western third of Missouri. Please refer questions to Nathan Kauffman, economist or Ty Kreitman, assistant economist at 1-800-333-1040.
The views expressed in this article are those of the authors and do not necessarily reflect the views of the Federal Reserve Bank of Kansas City or the Federal Reserve System.
Authors

Nate Kauffman
Senior Vice President, Economist, and Omaha Branch Executive; Executive Director of the Center for Agriculture and the Economy
