Further increases in farm debt pointed to growing concerns about the Tenth District’s agricultural economy. Loan demand continued to rise, repayment rates continued to weaken, and almost all District bankers reported that farm income declined in the first quarter of 2016. To mitigate their exposure to risk in this environment, District bankers raised collateral requirements somewhat and increased their use of government guaranteed loan programs. Although cash rents declined modestly, production costs generally have remained high and many producers reduced both capital and household spending in an effort to cut costs. Farmland values also moderated slightly and were expected to remain under pressure in the coming year.
Lending and Credit Conditions
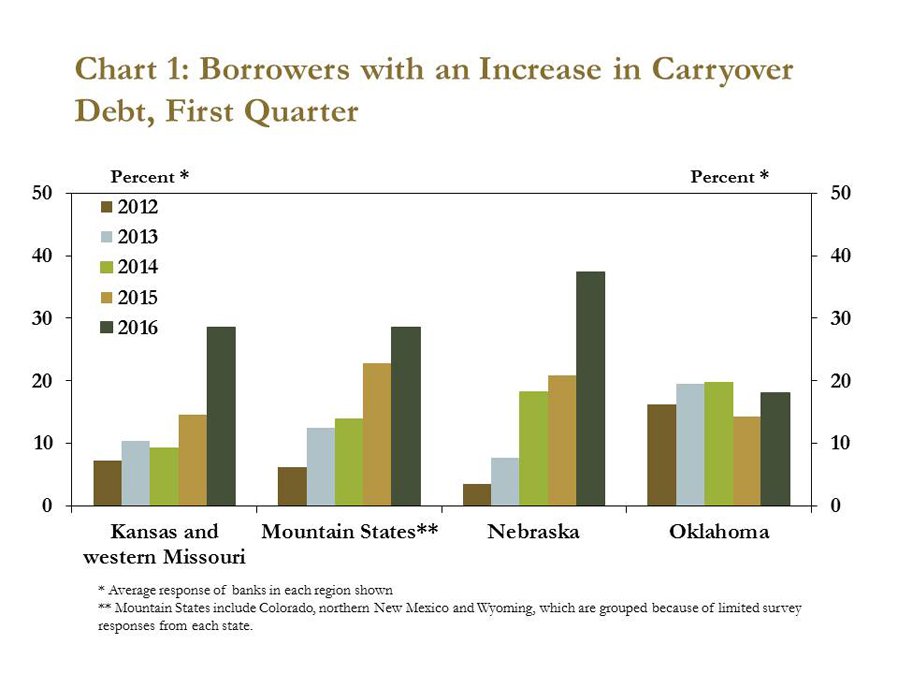
Farm sector credit conditions continued to deteriorate according to respondents of the Tenth District Survey of Agricultural Credit Conditions. Bankers noted that poor cash flow prevented many borrowers from paying off loans from the previous year, causing them to carry outstanding debt into the first quarter (Chart 1). The share of farm borrowers in the Tenth District with more carry-over debt than a year earlier increased from 18 percent in 2015 to 29 percent in the last quarter. Moreover, bankers noted that more than 18 percent of loans made in the first quarter involved restructuring existing debt to meet short-term liquidity needs.
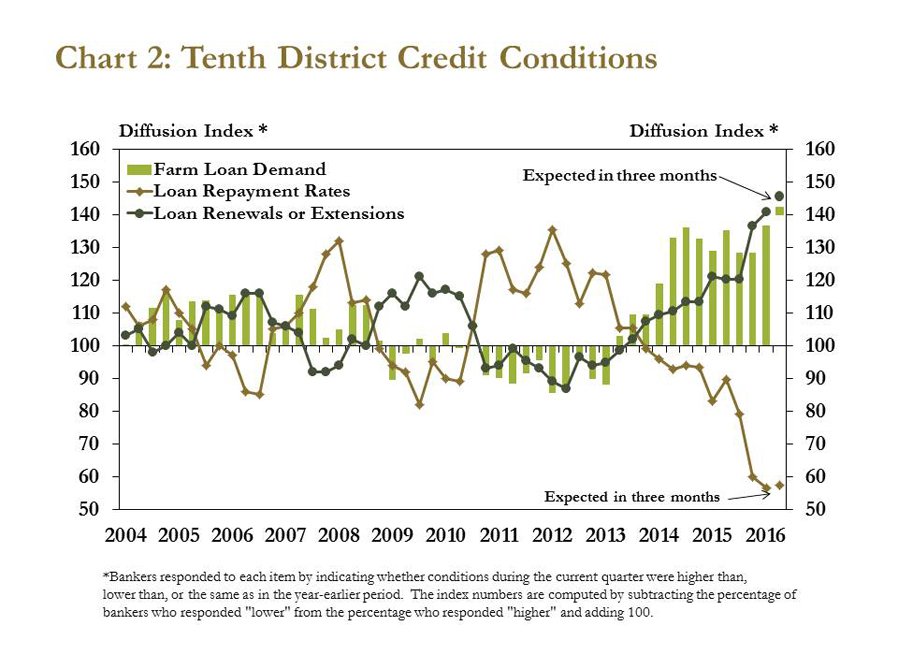
More generally, loan demand at agricultural banks in the Tenth District continued to climb and loan repayment rates weakened further. Through the first quarter, survey respondents reported three full years of increasing loan demand amid reduced profits (Chart 2). Similarly, loan repayment rates weakened for the 10th consecutive quarter, the longest streak of declining repayment rates since the early 2000s.
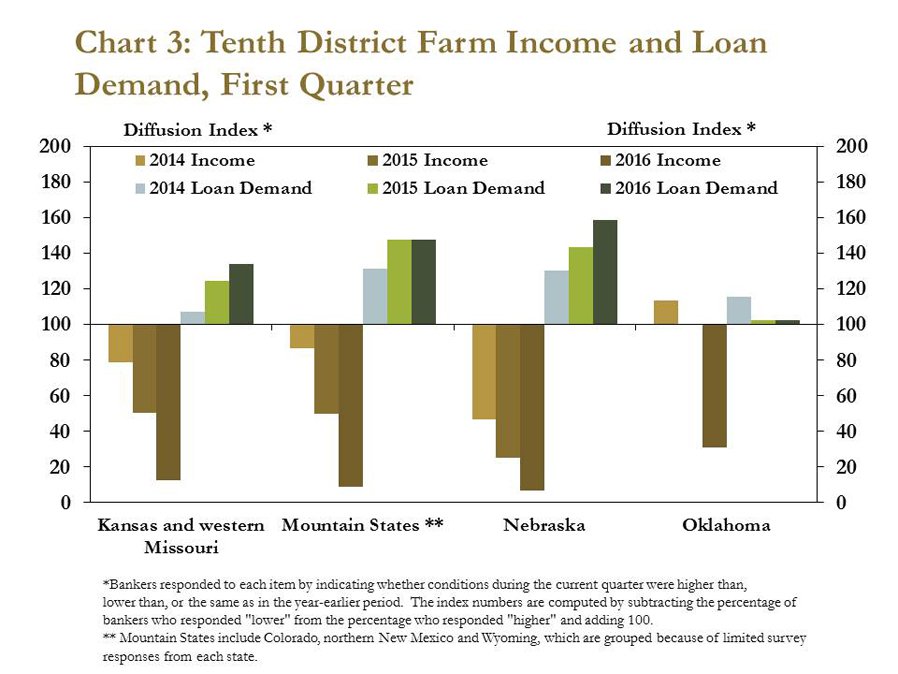
Loan demand continued to rise most significantly in states where farm income declined sharply. For example, 66 percent of bankers in Nebraska indicated that loan demand increased in the first quarter and almost all bankers in the state reported a decline in farm income from a year ago (Chart 3). Moreover, Nebraska bankers also reported that 37 percent of their farm borrowers had more carry-over debt than a year ago. Significant expansions in loan demand and the recent increase in carry-over debt underscored a heightened sense of risk in farm sector lending, particularly if incomes remain low.
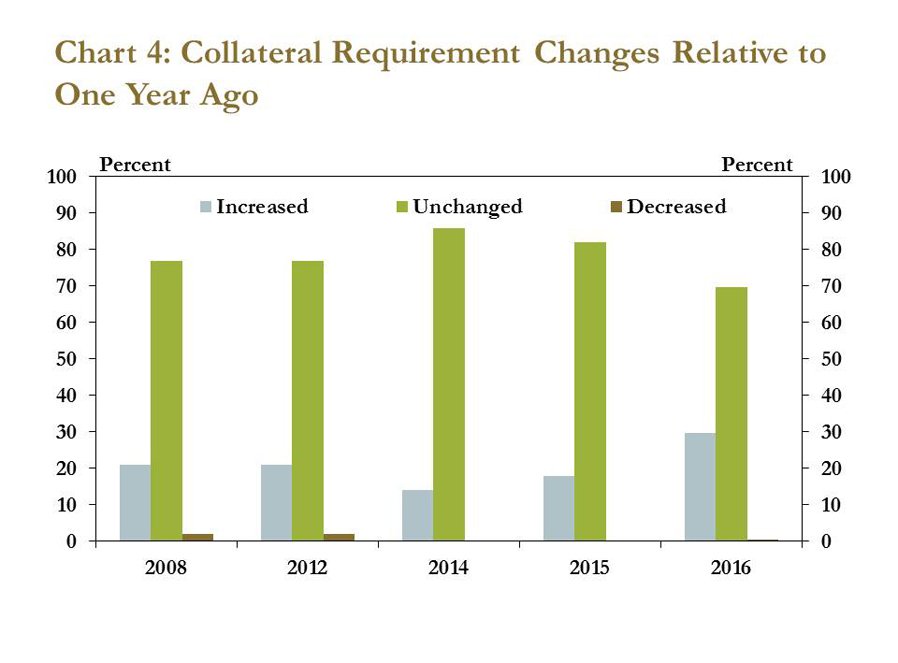
In response to perceptions of heightened risk, bankers raised collateral requirements in the first quarter. More than 30 percent of respondents—a significant increase from previous years—noted that collateral requirements rose in the first quarter (Chart 4). This bump in collateral requirements was discussed in the first quarter issue of the Ag Finance Databook, which reported that bankers sought to reduce exposure to lending risks by requiring more farm real estate as collateral for large, non-real estate farm loans.
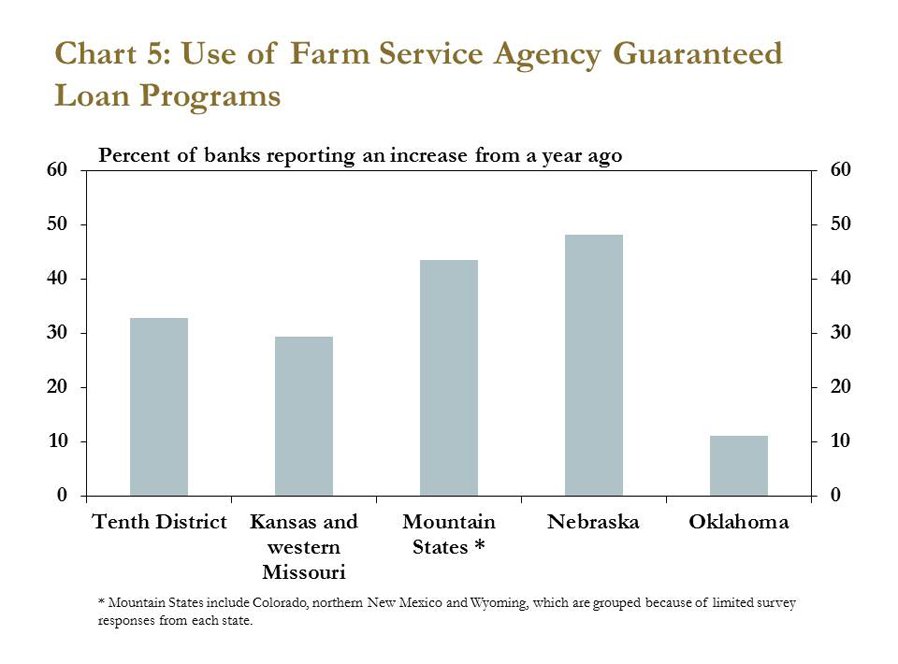
Bankers in the Tenth District also reported a significant increase in the use of guaranteed loan programs through the USDA Farm Service Agency. Bankers traditionally have used guaranteed loan programs to provide an additional layer of security for credit extended to new or marginal customers. In the first quarter, however, more than 30 percent of respondents indicated that their bank had increased the use of these loan programs from a year ago (Chart 5).
Farm Income and Spending
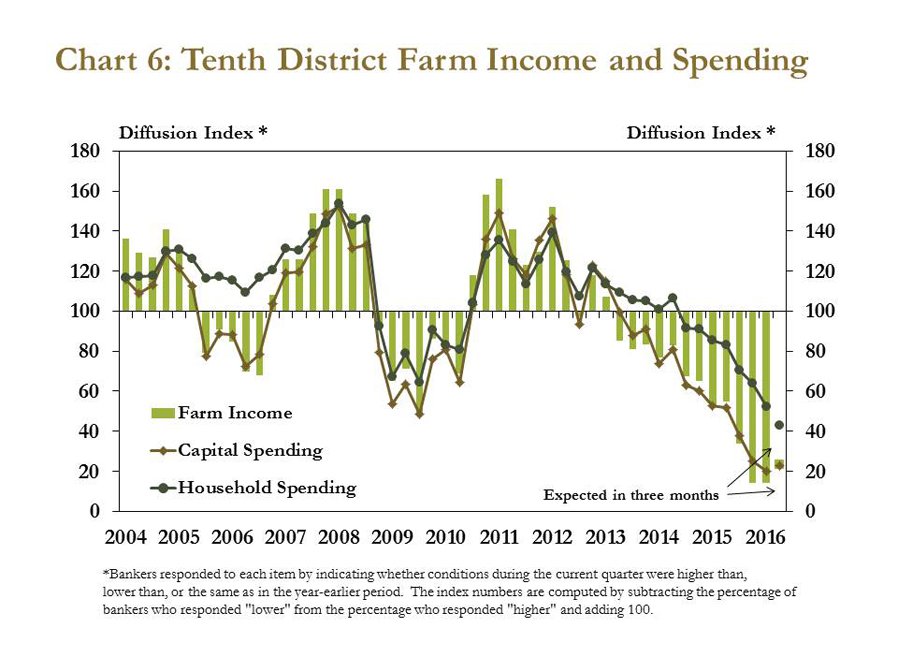
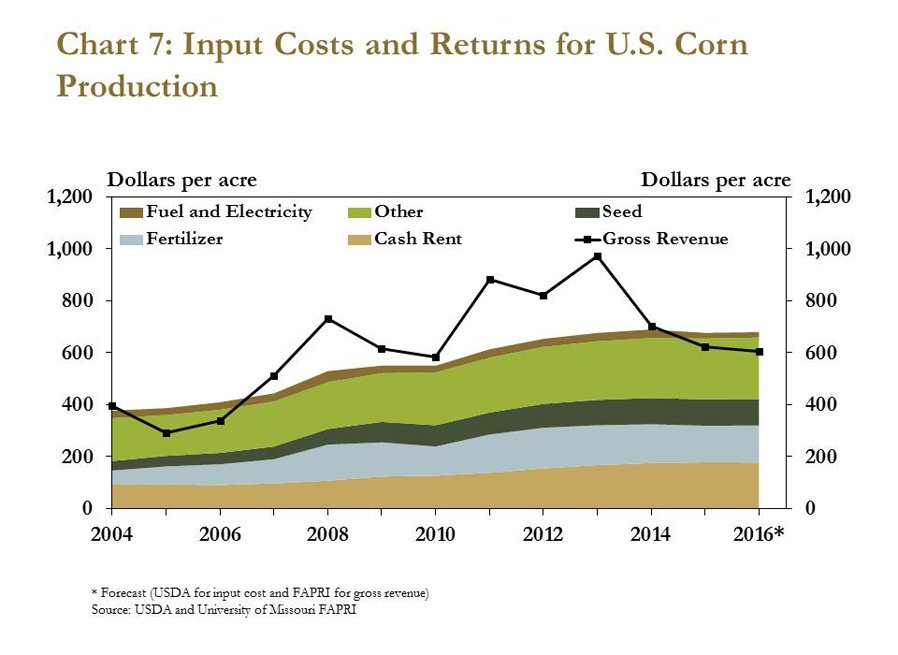
The ongoing decline in farm income remained the primary driver of weakening credit conditions and modified loan terms. In the first quarter, 86 percent of survey respondents reported a drop in farm income from a year ago (Chart 6). Persistently low prices for commodities have weighed on gross revenue while production costs have remained elevated, keeping profit margins for crop producers relatively tight (Chart 7). Capital spending softened alongside the declines in farm income, and more bankers also cited lower household spending. Moreover, 50 percent of bankers indicated that household spending fell in the first quarter, up sharply from 25 percent a year ago.
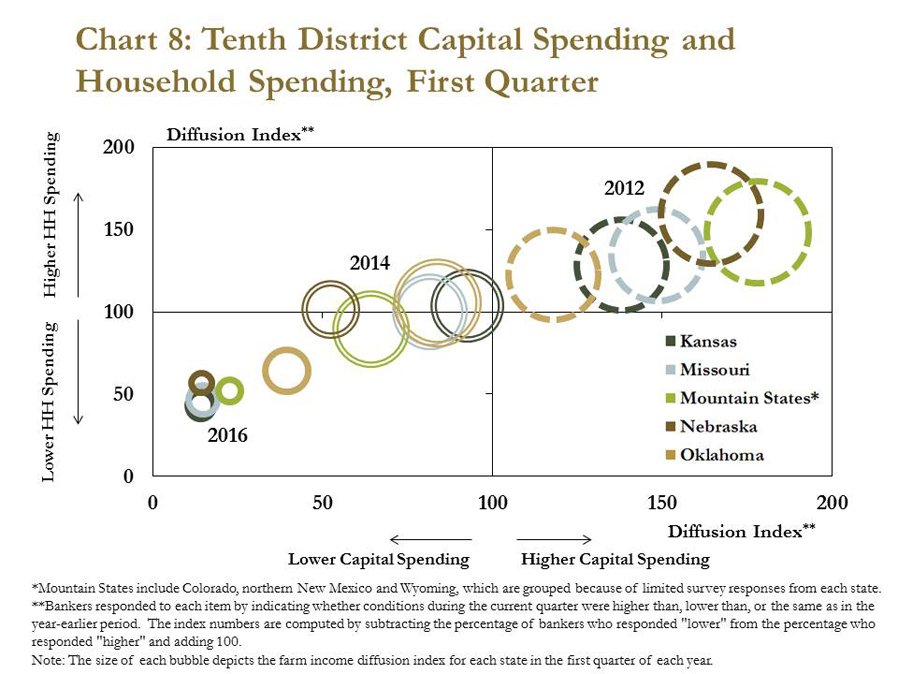
Declines in farm income have coincided with adjustments in farm household spending and capital spending in all District states over the last four years. Amid elevated farm income in 2012, household spending and capital spending had continued to increase in all District states following the near-record income of previous years (Chart 8). While capital spending had begun to slow in 2014, household spending had remained relatively steady. Since 2014, however, tightening profit margins have spurred reductions in both household and capital spending. In this year’s first quarter survey, more than half of bankers expected farm income, capital spending and household spending all would decline in the next three months.
Farmland Values and Cash Rents
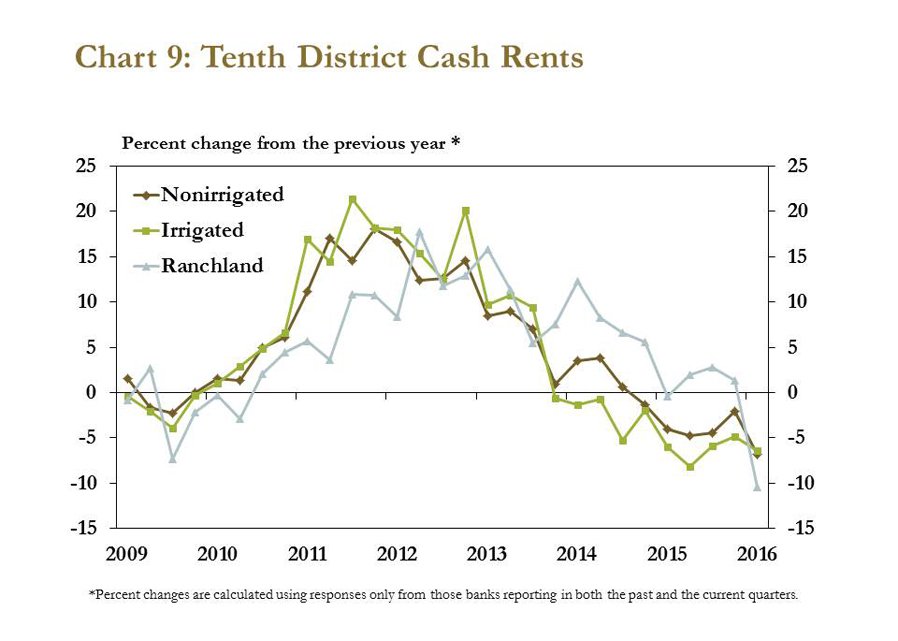
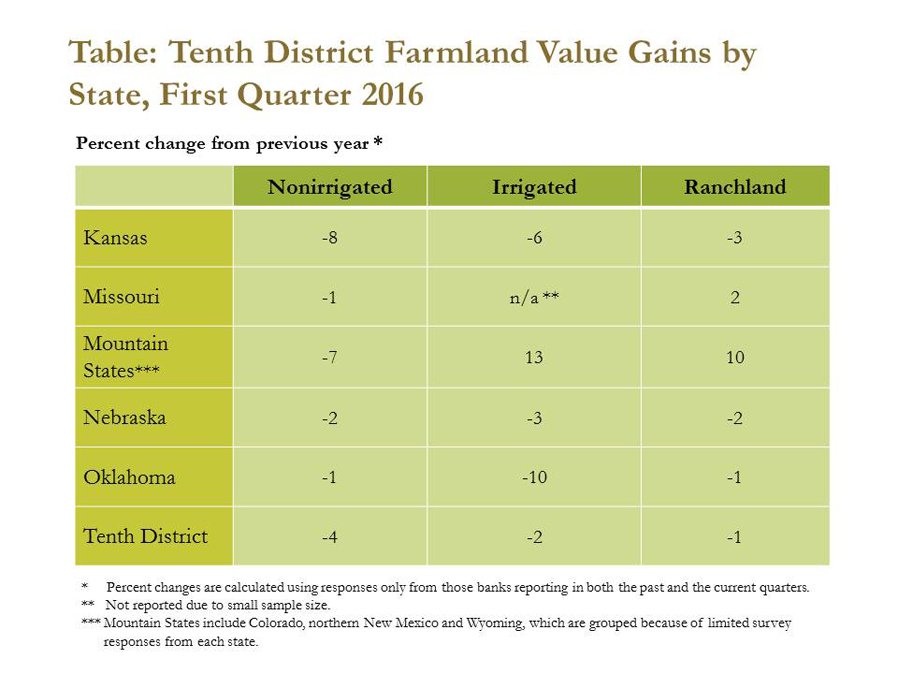
Although most costs associated with agricultural production have held firm, cash rents declined for all farmland types. After remaining positive through most of 2015, ranchland cash rents dropped in the first quarter, declining 10 percent from a year earlier (Chart 9). The sharp drop marked the largest annual decline in ranchland cash rents since the third quarter of 2009 and corresponded with a 30-percent decline in the price of feeder cattle over the same period. Ranchland cash rents increased slightly in Oklahoma and the Mountain States, but significant declines in Nebraska and moderate declines in Kansas weighed on the District average. District nonirrigated and irrigated cash rents were down 6 percent from the previous year, continuing trends of modest annual declines for both types of cropland.
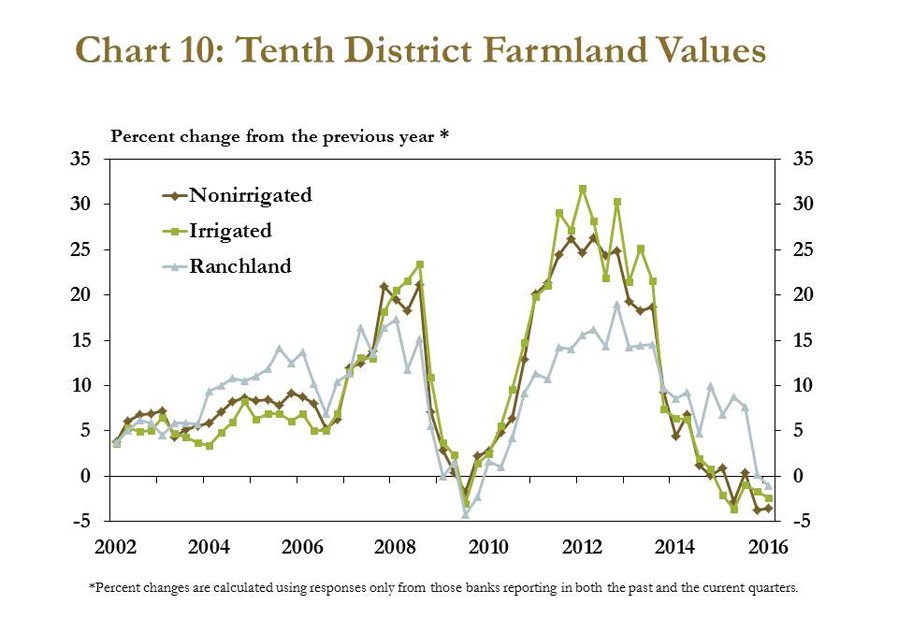
Similar to cash rents, nonirrigated and irrigated cropland values continued to moderate. Values declined for both types of farmland in all District states (Chart 10), with the exception of irrigated cropland in the Mountain States, which increased 13 percent from the previous year (Table). Over the same period, nonirrigated cropland in the Mountain States fell 7 percent, the largest annual decline for the District. The relatively wide disparity between the values of nonirrigated and irrigated cropland in the Mountain States could reflect the importance of irrigation in a region where annual precipitation varies significantly and averages just 15 inches.i Moving forward, about half of District bankers indicated they expect further declines in nonirrigated and irrigated farmland values. Contrary to ranchland cash rents, ranchland values remained unchanged, and 70 percent of survey respondents expected ranchland values to stay flat in the next quarter.
Looking Forward
The gradual tug of low farm income has pulled loan demand upward. This most recent uptick in loan demand may be more concerning because it has coincided with a period of falling repayment rates, softening farmland values and increasing collateral requirements. Despite lower repayment rates, delinquency rates on farm loans have remained low compared to historical standards and compared to delinquency rates on other types of loans outside of agriculture. However, marginal borrowers, particularly those with large capital debt and limited borrowing bases, may experience continued strains on liquidity. Moderating farmland values could also create additional concerns for lenders and borrowers, especially those who have become more highly leveraged.
_____________________________________________
i Source: National Climate Data Center, Historical Climatography Series 4-2. Summarized for the western United States by the Western Regional Climate Center. Available at: External Linkhttp://www.wrcc.dri.edu/climatedata/climtables/avgstate_ppt/. Accessed: April 29, 2016.
The views expressed in this article are those of the authors and do not necessarily reflect the views of the Federal Reserve Bank of Kansas City or the Federal Reserve System.
Author
