Chart 1
Skip to data visualization table| Quarter | Total Loans | C&I Loans | Small Business C&I Loans |
|---|---|---|---|
| 2021:Q1 | -1.79 | 0.124 | 5.975 |
| 2021:Q2 | -0.09 | -2.846 | -13.178 |
| 2021:Q3 | 0.014 | -1.694 | -16.572 |
| 2021:Q4 | 5.445 | 8.15 | -4.253 |
| Year-Over-Year 2021: Q4 | 3.479 | 3.421 | -26.503 |
Small business C&I loan balances in the fourth quarter decreased 4.3 percent quarter-over-quarter and 26.5 percent year-over-year. The continued decline in small business loan balances is likely attributed to the expiration of the PPP and an increase in PPP loan forgiveness payments. According to the SBA, 83 percent of the total PPP loan value had been forgiven as of December 26, 2021. This was a 13 percent increase in PPP loan forgiveness compared with the third quarter of 2021. Total loans and total C&I loans increased 3.5 percent and 3.4 percent, respectively, compared with the fourth quarter of 2020.
Small Business Lending Chart
Note: This is a chart.
Source: Research publications
Chart 2
Skip to data visualization table| Quarter | % of loans secured by SBA |
|---|---|
| 2018:Q2 | 7 |
| 2018:Q3 | 9 |
| 2018:Q4 | 8 |
| 2019:Q1 | 8 |
| 2019:Q2 | 8 |
| 2019:Q3 | 8 |
| 2019:Q4 | 8 |
| 2020:Q1 | 8 |
| 2020:Q2 | 47 |
| 2020:Q3 | 51 |
| 2020:Q4 | 40 |
| 2021:Q1 | 45 |
| 2021:Q2 | 37 |
| 2021:Q3 | 26 |
| 2021:Q4 | 18 |
Small business loan balances guaranteed by the SBA continue to decline due to PPP loan forgiveness but remain higher than before the start of the pandemic. In the fourth quarter of 2021, small business loan balances guaranteed by the SBA declined to 18 percent, a 41 percent total decline from the previous quarter. Pre-pandemic balances guaranteed by the SBA had remained steady at approximately 8 percent since the second quarter of 2018. The two most utilized SBA lending programs cited by respondents were the PPP and the 7(a) Loan Program.
Chart 3
Skip to data visualization table| Quarter | New C&I Loans | New C&I Term Loans | New C&I Credit Lines |
|---|---|---|---|
| 2021:Q1 | 444.86 | 612.19 | 56.74 |
| 2021:Q2 | -61.72 | -65.85 | -18.16 |
| 2021:Q3 | -36.55 | -48.49 | 15.96 |
| 2021:Q4 | 4.06 | -3.56 | 18.95 |
| Year-Over-Year 2021: Q4 | 37.72 | 20.81 | 76.94 |
Small business loan balances guaranteed by the SBA continue to decline due to PPP loan forgiveness but remain higher than before the start of the pandemic. In the fourth quarter of 2021, small business loan balances guaranteed by the SBA declined to 18 percent, a 41 percent total decline from the previous quarter. Pre-pandemic balances guaranteed by the SBA had remained steady at approximately 8 percent since the second quarter of 2018. The two most utilized SBA lending programs cited by respondents were the PPP and the 7(a) Loan Program.
Chart 4
Skip to data visualization table| Quarter | Total | Fixed Rate | Variable Rate |
|---|---|---|---|
| 2017:Q4 | 38.27505 | 36.33141 | 38.44104 |
| 2018:Q1 | 38.79458 | 29.62387 | 39.86941 |
| 2018:Q2 | 38.83515 | 35.06545 | 39.19591 |
| 2018:Q3 | 37.90699 | 39.85024 | 37.71072 |
| 2018:Q4 | 40.75945 | 43.24967 | 40.49223 |
| 2019:Q1 | 41.04557 | 43.65541 | 40.76575 |
| 2019:Q2 | 39.70819 | 41.38074 | 39.52806 |
| 2019:Q3 | 39.43139 | 37.56346 | 39.65742 |
| 2019: Q4 | 39.72744 | 37.15359 | 40.03511 |
| 2020:Q1 | 39.97501 | 36.41818 | 40.33681 |
| 2020:Q2 | 35.25879 | 37.68534 | 34.993 |
| 2020:Q3 | 33.46218 | 40.6377 | 32.65789 |
| 2020:Q4 | 32.19728 | 40.71613 | 31.33306 |
| 2021:Q1 | 30.82838 | 38.20001 | 30.16247 |
| 2021:Q2 | 30.76639 | 39.1666 | 29.97191 |
| 2021:Q3 | 32.00286 | 44.03787 | 30.93572 |
| 2021:Q4 | 31.55674 | 41.86303 | 30.70813 |
Small business loan balances guaranteed by the SBA continue to decline due to PPP loan forgiveness but remain higher than before the start of the pandemic. In the fourth quarter of 2021, small business loan balances guaranteed by the SBA declined to 18 percent, a 41 percent total decline from the previous quarter. Pre-pandemic balances guaranteed by the SBA had remained steady at approximately 8 percent since the second quarter of 2018. The two most utilized SBA lending programs cited by respondents were the PPP and the 7(a) Loan Program.
Chart 4: Credit Line Usage Remains Stable
Note: This chart is here as an example
Source: Research data
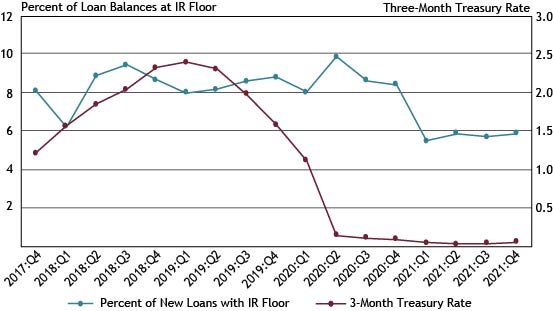
Chart 7
Skip to data visualization table| Quarter | Percent of New Loans with IR Floor | Three-Month Treasury Rate |
|---|---|---|
| 2017:Q4 | 8 | 1.21 |
| 2018:Q1 | 6 | 1.56 |
| 2018:Q2 | 9 | 1.84 |
| 2018:Q3 | 9 | 2.04 |
| 2018:Q4 | 9 | 2.32 |
| 2019:Q1 | 8 | 2.39 |
| 2019:Q2 | 8 | 2.3 |
| 2019:Q3 | 9 | 1.98 |
| 2019:Q4 | 9 | 1.58 |
| 2020:Q1 | 8 | 1.11 |
| 2020:Q2 | 10 | 0.143333 |
| 2020:Q3 | 9 | 0.11 |
| 2020:Q4 | 8 | 0.09 |
| 2021:Q1 | 5 | 0.05 |
| 2021:Q2 | 6 | 0.03 |
| 2021:Q3 | 6 | 0.04 |
| 2021:Q4 | 6 | 0.06 |
Chart 10
Skip to data visualization table| Quarter | Small | Midsized | Large |
|---|---|---|---|
| 2017:Q4 | 88.14 | 75.33 | 51.07 |
| 2018:Q1 | 87 | 86.15 | 56.78 |
| 2018:Q2 | 86.32 | 80.9 | 48.71 |
| 2018:Q3 | 85.07 | 85.5 | 52.83 |
| 2018:Q4 | 82.91 | 85.18 | 55.04 |
| 2019:Q1 | 89.81 | 86.15 | 55.12 |
| 2019:Q2 | 89.68 | 81.5 | 55.45 |
| 2019:Q3 | 79 | 80.93 | 54.01 |
| 2019:Q4 | 86.87 | 76.18 | 53.58 |
| 2020:Q1 | 87.44 | 75.45 | 51.93 |
| 2020:Q2 | 87.98 | 95.12 | 74.54 |
| 2020:Q3 | 86.52 | 89.81 | 38.33 |
| 2020:Q4 | 89.52 | 79.64 | 45.56 |
| 2021:Q1 | 89.73 | 88.23 | 51.24 |
| 2021:Q2 | 93.5 | 89.83 | 46.85 |
| 2021:Q3 | 71.2 | 85.2 | 49.78 |
| 2021:Q4 | 81 | 87.23 | 50.5 |
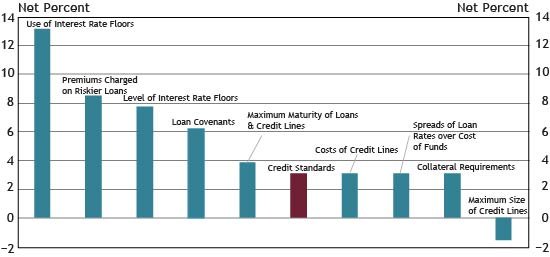
Chart 12
Skip to data visualization table| Credit Standards | Net Percentage |
|---|---|
| Use of Interest Rate Floors | 13.17829 |
| Premiums Charged on Riskier Loans | 8.527132 |
| Level of Interest Rate Floors | 7.751938 |
| Loan Covenants | 6.20155 |
| Maximum Maturity of Loans & Credit Lines | 3.875969 |
| Credit Standards | 3.100775 |
| Costs of Credit Lines | 3.100775 |
| Spreads of Loan Rates over Cost of Funds | 3.100775 |
| Collateral Requirements | 3.100775 |
| Maximum Size of Credit Lines | -1.55039 |
The views expressed are those of the authors and do not necessarily reflect the positions of the Federal Reserve Bank of Kansas City or the Federal Reserve System.