Small business commercial and industrial (C&I) lending_ declined sharply in the first quarter, decreasing 15.9 percent from the same period in 2022 and 6.8 percent from the previous quarter. Respondents reported declining loan demand for the fourth consecutive quarter, with the largest percentage of respondents reporting softening demand since the survey began. The 130 respondents to the survey indicated that credit standards tightened while credit quality decreased, and interest rates continued to rise. Most respondents indicated that lending to small businesses was unconstrained by available liquidity.
Chart 1: Small Business Loan Balances Decreased Year-Over-Year
Skip to data visualization tableNote: Items are calculated using a subset of 98 respondents that completed the FR 2028D for the last five quarters surveyed.
Sources: Call Report, Schedule RC-C Part I, items 4. Commercial and Industrial Loans and 12. Total Loans and Leases Held for Investment and Held for Sale, Small Business Administration, and FR 2028D, items 4.b and 5.c.
| Quarter-Over-Quarter | Total Loans | C&I Loans | Small Business C&I Loans |
|---|---|---|---|
| 2022:Q2 | 4.71 | 6.31 | -5.85 |
| 2022:Q3 | 1.46 | 2.00 | -3.98 |
| 2022:Q4 | 0.99 | 1.84 | 0.54 |
| 2023:Q1 | 2.35 | 2.77 | 1.62 |
| Year-Over-Year 2023:Q1 | 9.81 | 13.48 | -7.64 |
Small business loan balances decreased by 7.6 percent when compared to the first quarter of 2022. The decline is consistent with weaker loan demand and tightening credit standards reported by survey respondents. It is also consistent with steep declines in new small business C&I lending and continued declines in outstanding Paycheck Protection Program (PPP) loan balances over the same time period. Despite the year-over-year decrease in small business loans, total loans and total C&I loans increased 9.8 percent and 13.5 percent, respectively. When compared to the previous quarter, small business loans increased by 1.6 percent.
Chart 2: New Small Business Lending Declines
Skip to data visualization tableNote: Items are calculated using a subset of 98 respondents that completed the FR 2028D for the last five quarters surveyed. All loan types referenced in Chart 2 refer to small business lending.
Source: FR 2028D, items 7.b and 8.c.
| Quarter-Over-Quarter | Total New C&I Loans | New C&I Term Loans | New C&I Credit Lines |
|---|---|---|---|
| 2022:Q2 | -0.78 | 1.38 | -3.96 |
| 2022:Q3 | -13.22 | -9.74 | -18.64 |
| 2022:Q4 | 4.83 | -0.13 | 13.38 |
| 2023:Q1 | -6.83 | -7.04 | -6.51 |
| Year-Over-Year 2023:Q1 | -15.90 | -15.04 | -17.17 |
Compared to first quarter 2022, total new small business loan balances decreased 15.9 percent, driven by a 15.0 percent decrease in new term loans and a 17.2 percent decrease in new lines of credit. The year-over-year decline in new small business lending is consistent with weaker loan demand and tightening credit standards reported by survey respondents. Total new small business lending declined by 6.8 percent from the previous quarter, driven by reduced lending from large banks.
Chart 3: Credit Line Usage Remains Stable
Skip to data visualization tableSource: FR 2028D, items 5.b and 5.c.
| Quarter | Total | Fixed Rate | Variable Rate |
|---|---|---|---|
| 2017:Q4 | 38.28 | 36.33 | 38.44 |
| 2018:Q1 | 38.79 | 29.62 | 39.87 |
| 2018:Q2 | 38.84 | 35.07 | 39.20 |
| 2018:Q3 | 37.91 | 39.85 | 37.71 |
| 2018:Q4 | 40.76 | 43.25 | 40.49 |
| 2019:Q1 | 41.05 | 43.66 | 40.77 |
| 2019:Q2 | 39.71 | 41.38 | 39.53 |
| 2019:Q3 | 39.43 | 37.56 | 39.66 |
| 2019:Q4 | 39.73 | 37.15 | 40.04 |
| 2020:Q1 | 39.98 | 36.42 | 40.34 |
| 2020:Q2 | 35.26 | 37.69 | 34.99 |
| 2020:Q3 | 33.46 | 40.64 | 32.66 |
| 2020:Q4 | 32.20 | 40.72 | 31.33 |
| 2021:Q1 | 30.83 | 38.20 | 30.16 |
| 2021:Q2 | 30.77 | 39.17 | 29.97 |
| 2021:Q3 | 32.00 | 44.04 | 30.94 |
| 2021:Q4 | 31.56 | 41.86 | 30.71 |
| 2022:Q1 | 31.79 | 41.35 | 31.00 |
| 2022:Q2 | 32.08 | 36.64 | 31.63 |
| 2022:Q3 | 31.70 | 37.28 | 31.11 |
| 2022:Q4 | 32.49 | 39.80 | 31.63 |
| 2023:Q1 | 32.37 | 40.43 | 31.54 |
Usage of small business credit lines remained stable in the first quarter at 32 percent, despite a slight increase in the utilization of fixed rate credit lines. As of first quarter 2023, respondents indicated variable rate lines make up about 90 percent of total credit line usage.
Chart 4: Rates Increase on New Term Loans
Skip to data visualization tableNote: Items are calculated using a subset of 98 respondents that completed the FR 2028D for the last five quarters surveyed.
Source: FR 2028D, item 7.c.
| Quarter | Fixed New Term Loans | Variable New Term Loans |
|---|---|---|
| 2022:Q1 | 4.25 | 4.40 |
| 2022:Q2 | 4.78 | 5.25 |
| 2022:Q3 | 5.56 | 6.27 |
| 2022:Q4 | 6.43 | 7.52 |
| 2023:Q1 | 7.00 | 7.90 |
Median interest rates increased for new small business term loans in first quarter 2023. The variable and fixed median rates were reported as 7.9 percent and 7.0 percent, respectively. Since first quarter 2022, the median interest rates on fixed and variable rate term loans have increased by about 275 basis points and 350 basis points, respectively. The rate increases are consistent with the overall rising rate environment.
Chart 5: Rates Increase on New Lines of Credit
Skip to data visualization tableNote: Items are calculated using a subset of 98 respondents that completed the FR 2028D for the last five quarters surveyed.
Source: FR 2028D, item 8.d.
| Quarter | Fixed New LOC | Variable New LOC |
|---|---|---|
| 2022:Q1 | 4.22 | 4.46 |
| 2022:Q2 | 4.48 | 5.58 |
| 2022:Q3 | 5.47 | 6.81 |
| 2022:Q4 | 6.31 | 8.27 |
| 2023:Q1 | 6.72 | 8.52 |
Median interest rates on new small business lines of credit increased in first quarter 2023. The median interest rates for variable and fixed rate lines of credit were reported as 8.5 percent and 6.7 percent, respectively. This was a 25-basis point increase for variable lines and 41 basis point increase for fixed rate lines since the fourth quarter of 2022. The rate increases are directionally consistent with 450 basis point increase in the Federal Funds Rate since first quarter 2022.
Chart 6: New Loans with Interest Rate (IR) Floors Remain Stable
Skip to data visualization tableSources: FR 2028D, items 7.a, 7.f, 8.a, 8.e and Federal Reserve Bank of St. Louis, 3-Month Treasury Constant Maturity Rate.
| Quarter | Percent of Loan Balances with IR Floor | Three-Month Treasury Rate |
|---|---|---|
| 2017:Q4 | 8.07 | 1.21 |
| 2018:Q1 | 6.22 | 1.56 |
| 2018:Q2 | 8.86 | 1.84 |
| 2018:Q3 | 9.43 | 2.04 |
| 2018:Q4 | 8.64 | 2.32 |
| 2019:Q1 | 7.98 | 2.39 |
| 2019:Q2 | 8.15 | 2.30 |
| 2019:Q3 | 8.58 | 1.98 |
| 2019:Q4 | 8.80 | 1.58 |
| 2020:Q1 | 8.00 | 1.11 |
| 2020:Q2 | 9.82 | 0.14 |
| 2020:Q3 | 8.60 | 0.11 |
| 2020:Q4 | 8.39 | 0.09 |
| 2021:Q1 | 5.47 | 0.05 |
| 2021:Q2 | 5.85 | 0.03 |
| 2021:Q3 | 5.67 | 0.04 |
| 2021:Q4 | 5.85 | 0.06 |
| 2022:Q1 | 5.01 | 0.52 |
| 2022:Q2 | 4.87 | 1.72 |
| 2022:Q3 | 5.04 | 3.33 |
| 2022:Q4 | 5.14 | 4.42 |
| 2023:Q1 | 5.02 | 4.85 |
While the three-month Treasury rate increased 43 basis points in first quarter 2023, the percentage of new variable-rate loans with interest rate floors remained relatively stable for the eighth consecutive quarter.
Chart 7: Small Banks Report Decrease in Credit Line Usage
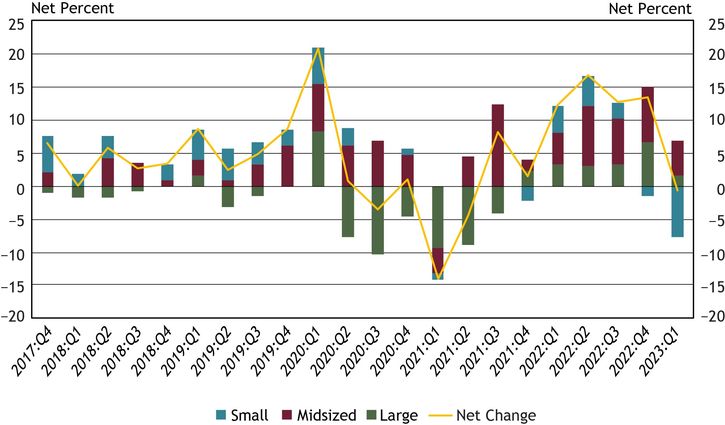
Note: Chart 7 shows diffusion indexes for credit line usage. The diffusion indexes show the difference between the percent of banks reporting decreased credit line usage and those reporting increased credit line usage. Net percent refers to the percent of banks that reported having decreased (“decreased somewhat” or “decreased substantially”) minus the percent of banks that reported having increased (“increased somewhat” or “increased substantially”)._
Source: FR 2028D, items 11 and 12.
In the first quarter, 30 percent of respondents reported a change in credit line usage, with 1 percent of respondents, on net, indicating that credit line usage decreased. On net, about 8 percent of small banks reported a decrease, while 5 percent of midsized banks and 2 percent of large banks reported an increase.
Of the banks reporting a decrease, 55 percent cited changes in pricing (rates, fees, etc.) as a very important reason, while 25 percent cited changes in national or local economic conditions. Of the banks reporting an increase, 42 percent cited changes in national or local economic conditions and changes in borrowers’ business revenue or other business-specific conditions as very important reasons.
Chart 8: Respondents Report Declines in Loan Demand for Fourth Consecutive Quarter
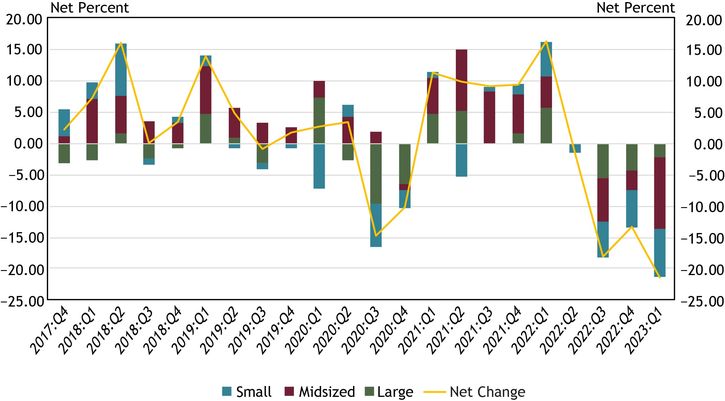
Note: Chart 8 shows diffusion indexes for loan demand. The diffusion indexes show the difference between the percent of banks reporting weakened loan demand and those reporting stronger loan demand. Net percent refers to the percent of banks that reported having weakened (“moderately weaker” or “substantially weaker”) minus the percent of banks that reported having stronger loan demand (“moderately stronger” or “substantially stronger”).
Source: FR 2028D, item 13.
About 52 percent of respondents reported a change in small business loan demand in the first quarter of 2023, an increase of 13 percent from fourth quarter 2022. This marks the fourth straight quarter of respondents reporting, on net, a decline in loan demand. On net, about 21 percent of respondents, the largest percentage since the survey began in 2017, indicated weaker loan demand across all bank sizes. The timing of the softening loan demand aligns with the Federal Reserve’s stance of monetary policy tightening since mid-2022. It is also consistent with the External LinkApril 2023 Federal Reserve Senior Loan Officer Opinion Survey (SLOOS), where about 62 percent of respondents reported weaker C&I loan demand from small firms (annual sales of less than $50 million) over the prior three months.
Chart 9: Most Respondents Indicate Lending Unconstrained by Availability of Liquidity
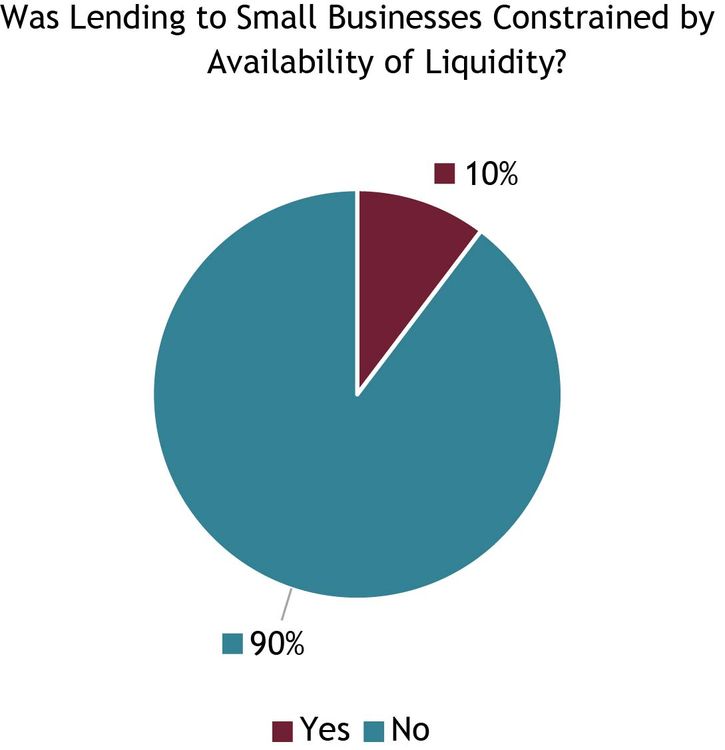
Source: FR 2028D, Special Question.
About 90 percent of respondents indicated their lending to small businesses was not constrained by the availability of liquidity in the market. About 13 percent of small banks reported lending was constrained by the availability of liquidity, with about 11 and 8 percent of midsized and large banks, respectively, reporting constraints. For the respondents who indicated lending was constrained, the most cited reason was greater competitive pressures for deposits (70 percent).
Chart 10: Credit Quality Decreases
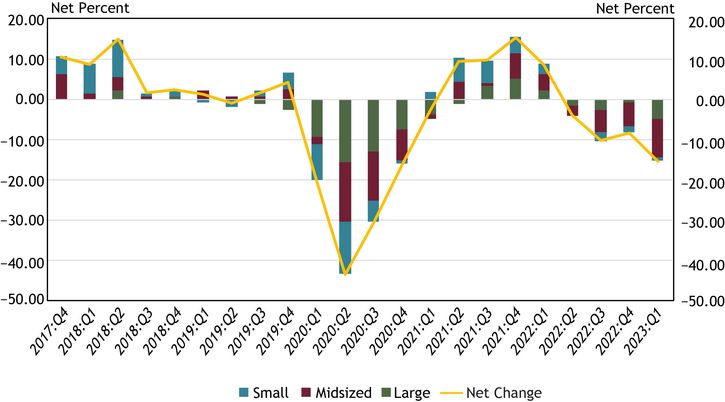
Note: Chart 10 shows diffusion indexes for credit quality of applicants. The diffusion indexes show the difference between the percent of banks reporting a decline in credit quality and those reporting improvement in credit quality. Net percent refers to the percent of banks that reported declining credit quality (“declined somewhat” or “declined substantially”) minus the percent of banks that reported improving credit quality (“improved somewhat” or “improved substantially”).
Source: FR 2028D, items 20 and 21.
About 15 percent of survey respondents, on net, reported a decrease in applicant credit quality. This is the fourth consecutive period in which respondents of all bank sizes, on net, reported a decrease. Of the respondents reporting a change in credit quality, whether an increase or decrease, 46 percent cited the liquidity position of business borrowers as a very important reason for a change. Other commonly cited reasons for a change include debt-to-income level of business owners, quality of business collateral and recent business income growth.
Chart 11: Application Approval Rates Remains Stable
Skip to data visualization tableSource: FR 2028D, items 14.a and 15.
| Quarter | Small | Midsized | Large |
|---|---|---|---|
| 2017:Q4 | 88.14 | 75.33 | 51.07 |
| 2018:Q1 | 87.00 | 86.15 | 56.78 |
| 2018:Q2 | 86.32 | 80.90 | 48.71 |
| 2018:Q3 | 85.07 | 85.50 | 52.83 |
| 2018:Q4 | 82.91 | 85.18 | 55.04 |
| 2019:Q1 | 89.81 | 86.15 | 55.12 |
| 2019:Q2 | 89.68 | 81.50 | 55.45 |
| 2019:Q3 | 79.00 | 80.93 | 54.01 |
| 2019:Q4 | 86.87 | 76.18 | 53.58 |
| 2020:Q1 | 87.44 | 75.45 | 51.93 |
| 2020:Q2 | 87.98 | 95.12 | 74.54 |
| 2020:Q3 | 86.52 | 89.81 | 38.33 |
| 2020:Q4 | 89.52 | 79.64 | 45.56 |
| 2021:Q1 | 89.73 | 88.23 | 51.24 |
| 2021:Q2 | 93.50 | 89.83 | 46.85 |
| 2021:Q3 | 71.20 | 85.20 | 49.78 |
| 2021:Q4 | 81.00 | 87.23 | 50.50 |
| 2022:Q1 | 83.15 | 77.35 | 51.31 |
| 2022:Q2 | 83.25 | 80.43 | 51.83 |
| 2022:Q3 | 86.77 | 86.50 | 48.34 |
| 2022:Q4 | 86.27 | 68.93 | 47.82 |
| 2023:Q1 | 86.96 | 67.96 | 49.66 |
Overall application approval rates remained unchanged. The most cited reason for denying a loan was borrower financials (67 percent). Other commonly cited reasons were credit history and collateral.
Chart 12: Respondents Reported Tightening Credit Standards for the Sixth Consecutive Quarter
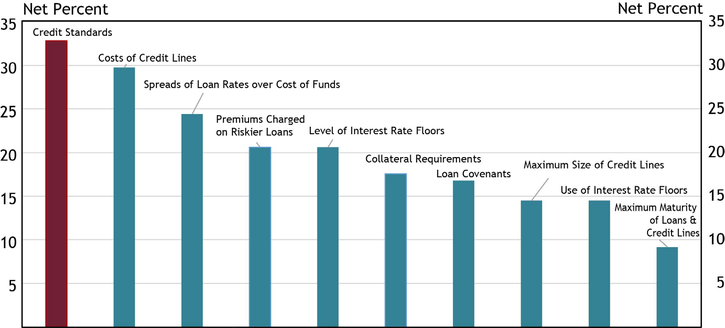
Note: Chart 12 shows diffusion indexes for credit standards (red bar) and various loan terms. The diffusion indexes show the difference between the percent of banks reporting tightening terms and those reporting easing terms. Net percent refers to the percent of banks that reported having tightened (“tightened somewhat” or “tightened considerably”) minus the percent of banks that reported having eased (“eased somewhat” or “eased considerably”).
Source: FR 2028D, items 16, 17, 18 and 19.
About 36 percent of respondents reported a change in credit standards in first quarter 2023, up about 13 percent from fourth quarter 2022. Of those indicating a change in credit standards, 33 percent, on net, reported tightening credit standards. This is the largest percentage since the onset of the pandemic in second quarter 2020 and the sixth consecutive quarter respondents reported tightening credit standards. On net, respondents indicated that all loan terms tightened with the cost of credit lines, spread of loan rates over cost of funds, premiums charged on riskier loans and the level of interest rate floors tightening the most. Respondents cited less favorable or more uncertain economic outlook, worsening industry-specific problems, and reduced tolerance for risk as the primary drivers.
Other contributors to the release include Lauren Bennett, Nicholas Bloom, Thomas Hobson, Alli Jakubek, Stefan Jacewitz, Emily Robinson, and Karen Thompson.
Endnotes
-
1 Small business lending refers to small business Commercial & Industrial lending unless explicitly noted otherwise. Small businesses are generally defined as organizations with less than five million in gross annual revenue.
-
2 Small banks have total assets of $1 billion or less, midsized banks have total assets between $1 billion and $10 billion and large banks have total assets greater than $10 billion.
The views expressed are those of the authors and do not necessarily reflect the positions of the Federal Reserve Bank of Kansas City or the Federal Reserve System.
Authors

Dustyn DeSpain, Assistant Vice President
Assistant Vice President