The Tenth District LMI Labor Force Report, which is released biannually, provides a snapshot of low- and moderate-income (LMI) labor market conditions in the Federal Reserve’s Tenth District. LMI individuals have incomes less than 80 percent of area median income, which is defined as metropolitan median income for urban residents and state median income for rural residents. The analyses provide trends in unemployment rates, employment projections for workers with training and experience typical of the LMI, wage data, and the LMI Job Availability Index from the Kansas City Fed’s LMI Survey. In many cases the data and analyses are specific to LMI populations, while in other cases general labor market information is presented that is likely to be highly relevant to LMI populations. The goal of the Tenth District LMI Labor Force Report is to provide community development and social service organizations, policymakers, and others a gauge of District LMI labor market conditions. A variety of data and statistics are provided from issue to issue.
LMI Job Availability
The Federal Reserve Bank of Kansas City sends a semiannual survey (quarterly prior to second quarter of 2014) to organizations that work directly with the LMI population. One set of questions in the survey asks about the availability of jobs for LMI workers. Survey responses are used to create diffusion indexes that range from zero (most deterioration in conditions) to 200 (most improvement in conditions), where 100 is neutral. A diffusion index has a rolling benchmark, which means it registers changes in conditions, as indicated by the selection of “better” (or “higher”), “worse” (or “lower”), or “about the same.” Any index value more than 100 indicates improving conditions and any value less than 100 indicates deteriorating conditions, regardless of which direction the index is moving. Thus, the index may be increasing in value, but if it lies below 100, it indicates a general assessment of decline in the number of jobs available to LMI workers. Indexes are created to compare current conditions to those in the previous quarter and the previous year. Survey respondents also are asked to make projections for the quarter ahead.
The Job Availability Index for the Tenth District has improved substantially since early 2009, when the LMI Survey was launched (Chart 1). Beginning in 2012, most indexes climbed above neutral. Most recently (fourth quarter, 2013), the index reflecting current job availability compared to one year ago was 109.9, solidly in positive territory. In the third quarter, the index was significantly higher at 122.7, but again, a decline in the index does not imply a decline in job availability. The positive value in the fourth quarter, though lower than in the third quarter, still indicates improvement in job availability. The index comparing current job availability to the previous quarter and the quarter-ahead outlook both returned to positive territory.
Chart 1: Federal Reserve Bank of Kansas City LMI Job Availability Index
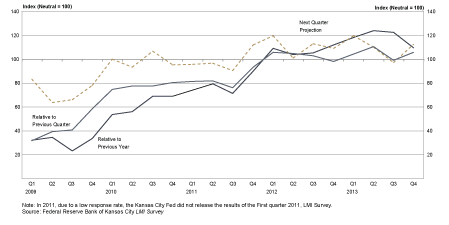
Growth in job availability for LMI workers lagged employment growth in the overall labor market for a significant period. The diffusion index for national employment (U.S. Bureau of Labor Statistics), which is similar but measures employment growth rather than job availability, turned positive in April 2010, while for LMI workers in the Tenth District, diffusion indexes (previous quarter or one year ago) did not turn positive until the first quarter of 2012.
Unemployment in LMI Communities
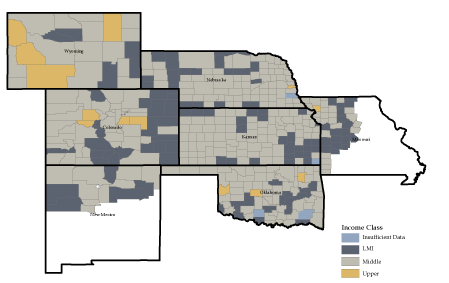
Unemployment rates by income group are not reported in government statistics, and disentangling unemployment and income is difficult. For example, an unemployed worker is likely to have low income. If the LMI are viewed as a community, an analysis of unemployment by income group is more tractable. In this report, unemployment rates by income group are computed using county unemployment rates. Counties are the lowest level of geography in which unemployment rates are reported. Counties are identified as LMI, middle-income, and upper-income (Map). Then a population-weighted average is calculated for each income cohort quarterly.
Tenth District Counties by Income
Tenth District weighted average unemployment rates by income cohort followed a similar pattern from the first quarter of 2000 through the first quarter of 2014, but unemployment rates varied significantly across income cohorts (Chart 2). In particular, unemployment rates in LMI counties were much higher than unemployment rates in middle-income and upper-income counties. Of course, disentangling unemployment from income is difficult. For example, low income could arise from high unemployment. However, unemployment rates are consistently higher in low-income counties, likely a reflection of structural issues, especially with the labor force. Incomes and unemployment are highly correlated with educational attainment, and residents of LMI counties typically have lower educational attainment than those in higher-income counties.
Chart 2: Population-Weighted Average Unemployment Rates for Income-Based County Cohorts
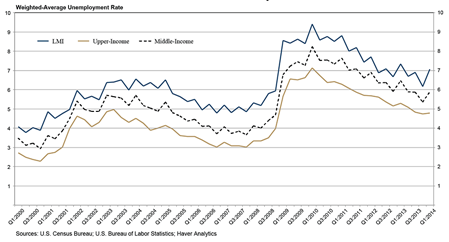
From the third quarter of 2013 to the first quarter of 2014, the weighted-average unemployment rate for LMI counties increased 0.2 percentage point. In contrast, weighted-average unemployment rates changed negligibly in middle-income counties and fell modestly in upper-income counties. The District unemployment rate was little changed.
LMI Job Projections
As noted above, LMI workers tend to have lower education levels and more sporadic work experience. Table 1 ranks the top 10 occupations projected to produce net new jobs with different combinations of education and experience, geared largely to the typical attributes of LMI workers.
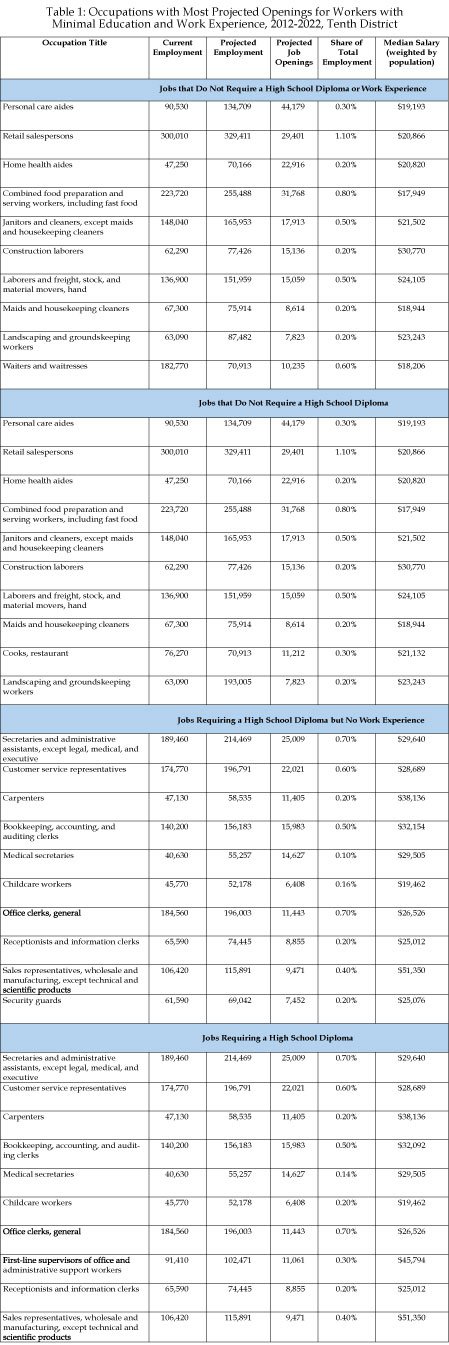
For workers with little or no job experience and little education, occupations in personal care and retail sales are projected to produce the most new jobs. Personal care aides in the Tenth District earned a median salary of about $19,200 in 2012, compared to a national median of slightly above $19,000. Retail salespersons has the second-most projected openings in the District at 29,401 on net and 69,648 gross (including replacement from turnover). Retail salespersons earned $21,110 in 2012. Wages/salaries in all occupations requiring little education or experience would place a worker in the LMI category, except for those in a single-member household._ Even in that case, only four of ten occupations would put a worker above the LMI threshold of $22,441.
Many of those with limited education and training and little or no work experience have found employment in the healthcare sector, and low-skill healthcare employment is expanding rapidly. Based on national occupational employment projections, the Tenth District is expected to see an additional 44,179 personal care aide positions and 70,166 home health aide positions by 2022. Turnover is significant in these positions; thus, job openings will likely be substantial relative to the net number of new positions.
A high school diploma makes a significant difference in median earnings for the fastest-growing occupations. Many of these positions provide earnings of more than $30,000. Nevertheless, these earnings would still put a worker in a family household with no other wage earners in the LMI category. Sales representatives in the wholesale and manufacturing field (except technical and scientific products) commanded the highest median salary at $54,230 per year, but earnings at that level are very unusual for a worker with the attributes of a typical LMI worker. A number of LMI individuals—particularly women—are employed as childcare workers, a job that requires a high school diploma in most cases, according to the U.S. Department of Labor’s Occupational Outlook Handbook. The demand for childcare workers is expected to expand substantially over the next decade, but at $19,510, the median wage is low.
Experience does not seem to affect the fastest-growing occupations or the wage that can be commanded. For a given level of education, the fastest growing occupations projected over the next several years change little with work experience. The fastest growing occupations (and median wages) change significantly depending on whether one has earned a high school diploma or not.
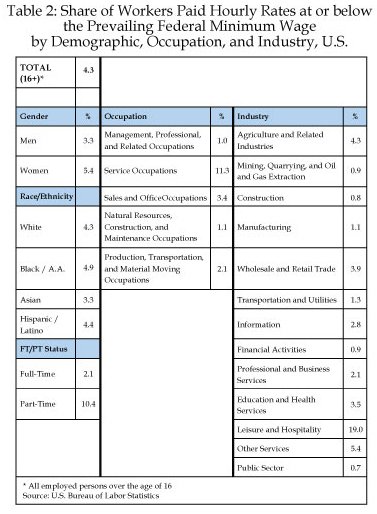
Many occupations pay a significant share of their workers the national minimum wage, currently $7.25 per hour (Table 2). In particular, 11.3 percent of workers in service occupations and 19 percent of workers in the leisure and hospitality industry earn the minimum wage. Workers with the characteristics typical of most LMI workers commonly work in the service industry, particularly in occupations in the leisure and hospitality industry. LMI workers also are more likely to work part time, and a much larger share of part-time workers earns the minimum wage than those working full time.
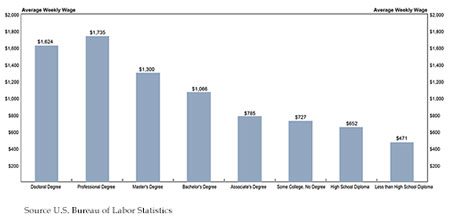
The advantages of education are illustrated by average weekly wages by educational attainment (Chart 3). Education attainment is one of the most significant determinants of earnings. Weekly wages increase significantly with additional education. The average worker with a bachelor’s degree earns 126 percent more than a worker with no high school diploma. Those with associate degrees average 67 percent more than those with no high school diploma. Dropping out of school before earning a diploma occurs in all income strata, but is more common in LMI communities. In general, LMI workers are relatively much less educated, which is likely to keep them anchored in low-wage, low-quality jobs.
Chart 3: Average Weekly Wages by Education Attainment
Endnotes
-
1 The LMI threshold in 2012 was $22,441 for individuals and $41,097 for households.
The views expressed are those of the authors and do not necessarily reflect the positions of the Federal Reserve Bank of Kansas City or the Federal Reserve System.