I. Economic Update for LMI Communities
The first section of the LMI Economic Conditions Report is an assessment of economic conditions in low- and moderate-income (LMI) communities in the Tenth District, which encompasses Colorado, Kansas, the western third of Missouri, Nebraska, the northern half of New Mexico, Oklahoma and Wyoming. A person, household, or community is LMI if income is below 80 percent of area median income. For urban areas, area median income is metropolitan median income. For non-metro areas, area median income is state median income.
Section I-A examines general perceptions of economic conditions in LMI communities and the demand for services from community organizations. Section I-B focuses on labor market conditions and job availability. Sections 1-C and 1-D focus on affordable housing and access to credit, respectively. Section II focuses on a special topic: income and health in the LMI community.
I-A. General Assessment
The LMI Economic Conditions Index, the broadest measure of economic conditions in the LMI community, rose significantly from 65.2 to 73.2, indicating fewer respondents are perceiving deterioration in economic conditions (all references to an index are current conditions relative to the previous year unless stated otherwise) (Chart 1). Still, the index remained well below the neutral value of 100 (see Box). Values for all indexes are in Table 1. Other indicators of economic and financial conditions in the LMI community were mixed in the July LMI Survey (July survey). The job availability indexes surged to well above neutral—both year-over-year and quarter-over-quarter readings—while housing affordability indexes continued to slump. Expectations for job affordability going forward changed little but remained well above neutral.
Diffusion Indexes
Survey participants respond to each survey question by indicating whether conditions during the current quarter were higher (better) than, lower (worse) than or about the same as in the previous quarter or year. An index showing conditions relative to the previous quarter is termed a “quarter index,” while an index comparing conditions to one year ago is termed a “year index.” Providers also are asked what they expect conditions to be in the next quarter (“expectation index”). Diffusion indexes are computed by subtracting the percentage of survey participants that responded lower (worse) from the percentage that responded higher (better) and adding 100. The exception is the LMI Services Needs Index, which is computed by subtracting the percentage of survey participants that responded higher from the percentage that responded lower and adding 100 so that higher needs translate into lower numbers for the index. A reading less than 100 indicates the overall assessment of respondents is that conditions are worsening. For example, an increase in the index from 70 to 85 would indicate conditions are still deteriorating, by consensus, but that fewer respondents are reporting worsening conditions. Any value more than 100 indicates improving conditions, even if the index has fallen from the previous quarter or year. A value of 100 is neutral.
Chart 1. LMI Economic Conditions Index
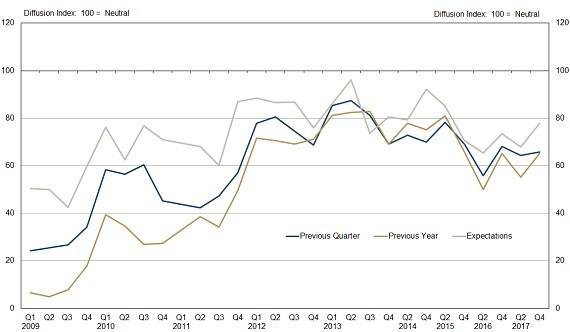
Source: Federal Reserve Bank of Kansas City LMI Survey.
Table 1. Diffusion Indexes for Low- And Moderate-Income Survey Responses

Source: Federal Reserve Bank of Kansas City LMI Survey.
Notes: The diffusion indexes (see box), were computed from responses to the Federal Reserve Bank of Kansas City’s biannual LMI Survey, administered in July 2018. The survey asks respondents about conditions in the previous quarter and year as well as expectations for the next quarter.
As noted in the March issue of LMI Economic Conditions, the consensus among survey respondents that economic conditions in the LMI community are deteriorating in the face of a booming national economy and so far into the recovery from the Great Recession, is a conundrum. In that issue, the LMI Economic Conditions Index (then the LMI Financial Condition Index) was found to move most closely with the Consumer Confidence Index for those with incomes less than $15,000, suggesting that the consensus view of deteriorating conditions may reflect experiences with the poorest of respondents’ clients.
To gain additional insights into this puzzle, a special question in the July survey asked respondents directly why they feel economic conditions in the LMI community are so poor (and getting worse) when the economy as a whole appears robust.
As indicated by the Job Availability Index, discussed in detail later in the text, most survey contacts report that plenty of jobs are available for LMI workers. But many contacts argue that these job opportunities have come with stagnant wages. They also note these jobs often have no benefits, particularly health insurance. Of particular concern was stagnant wages in tandem with higher costs of living.
Overall inflation has been tame over the last several years, with prices over the last 10 years rising at an annual rate of 1.4 percent1. But LMI household budgets are disproportionately absorbed by some items that have seen more significant prices increases, as measured by subcomponents of the Consumer Price Index (CPI) (Chart 2). In particular, CPI rent of primary residence has increased 2.4 percent annually over the last 10 years, and multifamily rents have increased even more sharply, by 2.9 percent annually.2 Rent prices have increased much faster in Denver, with CPI rent of primary residence increasing at an annual rate of 4.6 percent. Most survey responses that noted a higher cost of living as an issue mentioned housing specifically.
Chart 2. Selected Price Indexes
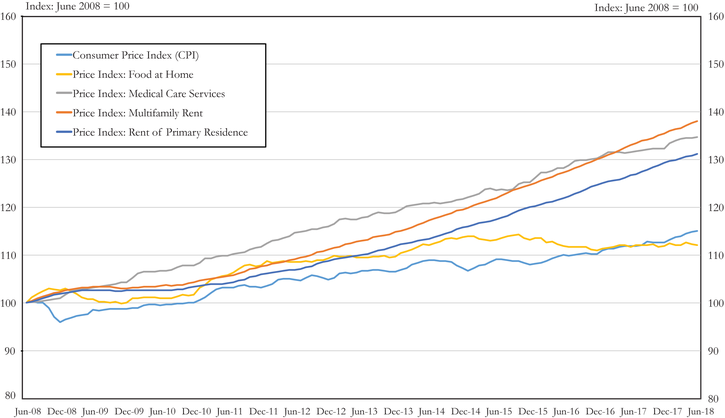
Source: U.S. Bureau of Labor Statistics/HAVER Analytics; Federal Reserve Bank of Kansas City (multifamily price index)
Health-care prices also have increased, rising over the last 10 years at an annual rate of 2.3 percent. Potentially compounding this increase, health insurance coverage for those younger than 65 and not eligible for Medicare is 73.2 percent for those with annual incomes less than $15,000 and 69.5 percent for those with annual incomes between $15,000 and $25,000.3 Comparatively, nearly all individuals with annual incomes more than $50,000 are covered by some form of health insurance. Those without health insurance are more likely to feel the rising cost of medical care because out-of-pocket expenditures are more likely (or they may do without some medical care—see section II).
Other items that make a disproportionate share of the LMI consumer basket are food and gasoline. Food costs have risen less than the overall CPI measure at an annual rate of 1.0 percent, while gasoline prices have increased only 0.5 percent annually. Price dynamics for these items can mitigate the impact on household budgets for rising costs of rent and health care, although rent is the largest share of consumer expenditure for most LMI households. Gasoline prices have increased 3.3 percent over the last six months amid a rise in oil prices.4
Although wage increases for production and nonsupervisory workers have not kept pace with inflation, rising only 0.4 percent annually over the last 10 years, some industries that employ a large number of workers from LMI communities have seen sharper wage gains. In particular over the same time, the average wage for those in retail trade has increased at an annual rate of 1.7 percent, and the average wage for those in the leisure and hospitality industry has increased 2.0 percent annually.5
Some respondents expressed that political uncertainties have created a negative pall over many in the community development sector. They also suggest that some recent policies have not benefitted the LMI while benefitting other groups. Specifically, some suggested that tax reform did not provide many benefits to LMI individuals and families, in part because they already tend to pay little or no income tax. Survey contacts also noted that the large majority of LMI workers do not have a 401(k) or other investments, so they received no wealth benefits from the large gains in stock prices.
Additional explanations for pessimistic assessments of economic conditions in LMI communities were geographically specific. For example, several respondents in agricultural communities related poor LMI outcomes to difficulties in the agriculture sector.6 In contrast, respondents in areas with concentrated oil and gas sectors were more upbeat.
A number of additional comments regarding the generally downbeat assessment of LMI economic conditions relate to the labor and housing markets, and also health. These comments are discussed in the context of other data in following sections of the report and in the special topic section.
The LMI Services Needs Index, another broad measure of economic conditions in the LMI community, was flat, remaining persistently low at 43.7. The LMI Services Needs Index reflects the demand for services from survey respondents, who are largely social- and community-services providers. Greater demand reflects poorer economic conditions and reduces the value of the index.
Many survey respondents work in the housing arena and have noted increased needs for their services in the face of higher rents and a limited availability of affordable housing. Others reported more temporary concerns that nonetheless can create significant increases in demand. Among the most common was the need for assistance with utilities in the face of extreme summer heat in most of the Tenth District. High utility bills affect not only those organizations that provide direct assistance with utility bills, but also other service providers. For example, higher utility bills may leave fewer resources available for food, which could increase the demand for services provided by food banks.
I-B. Labor Market Conditions
Basic Labor Market Metrics
This issue contains a much-expanded set of labor market metrics (Table 2). In particular, the metrics include labor market indicators by education, race and ethnicity and provide comparison figures from one year ago.7
Table 2. Labor Market Metrics

Sources: Federal Reserve Bank of Kansas City calculations using microdata from the Current Population Survey; Federal Reserve Bank of Kansas City; U.S. Bureau of Labor Statistics
Notes: /a/ Unemployed and have looked for work in the last four weeks /b/ Calculated as the share of the labor force that is officially unemployed (no job and looked in past four weeks) + those who are working part time for economic reasons (cannot find a full-time job) + discouraged workers. Discouraged workers are those who would like a job but have given up their search because they find it futile. The U-6 unemployment rate, which is typically reported as the alternative unemployment rate, includes all workers marginally attached to the labor force, of which discouraged workers are a subset. The U-6 unemployment rate for the nation was 8.1 percent in June 2018, not seasonally adjusted. /c/ The share of the unemployed out of work for 27 weeks or longer. /d/ Share of the working age population (16+) either employed or unemployed and actively seeking employment. /e/ All statistics for the U.S. and District are seasonally adjusted. All other statistics in the table are not seasonally adjusted. /f/ “Some college” includes those with an associate degree. /g/ Racial categories reflect those who report only one race. The unemployment rate for “other” is 6.9 percent. /h/ The July 2018 statistic is 62.9, reflecting no change from June.
Unemployment rates remain historically very low for both the nation and especially the District. The official U.S. unemployment rate was 4.0 percent in June (3.9 percent in July), down from 4.3 percent in June 2017. The District unemployment rate, which typically is lower than the national rate, was 3.4 percent in June, down from 3.6 percent in June 2017.8 An alternative unemployment rate, which includes not only the officially unemployed (those who sought work in last four weeks) but also discouraged workers and reluctant part-time workers, was 7.5 percent nationally in June, down from 8.3 percent in June 2017.9 Discouraged workers are those who would like a job but are not actively seeking employment because they find the search to be futile. Discouraged workers are not considered part of the labor force. There are insufficient data to calculate this alternative unemployment rate for the District.
The unemployment rate for workers in LMI households is considerably higher than the nation as a whole at 8.5 percent, but is down significantly from 9.2 in June 2017.10 The alternative unemployment rate described above also is much higher for LMI workers at 15.2 percent in June, down from 16.5 percent in June 2017. Consistent with these elevated unemployment rates are higher unemployment rates for the less-educated and minorities, who are more likely to be low income. Also consistent with higher alternative unemployment rates for the LMI is a higher rate of reluctant part-time workers in LMI communities, which, in turn, is consistent with a higher likelihood that LMI workers would hold jobs paying hourly wages.
The labor force participation rate was 62.9 percent in June (and July), still well below the pre-recession level of about 66 percent. Labor force participation has leveled off in recent years as the economy has recovered from the recession, but the long-term trend is downward. The trend is largely demographic, but the labor force participation rate of prime-age men (ages 25 to 54) is declining, which can be attributed largely to the decline in middle-skill jobs.11
The LMI labor force participation rate, at 45.5 percent in June, is substantially lower than the rate for the working-age population as a whole. This topic was discussed at length in the March issue of LMI Economic Conditions. A common refrain from our survey respondents is that a lack of child care and adequate transportation are significant factors keeping LMI individuals from joining the labor force. Health issues and related disabilities also are a significant deterrent to labor force participation, a problem discussed in this issue’s special topic.
Of those who are unemployed, the share that has been unemployed long term (27 weeks or longer) continues to decline, falling from 21.9 percent in June 2017 to 19.7 percent in June 2018. The long-term share of total unemployment has declined on a modest, consistent path since its 2010 peak of 45.5 percent. Long-term unemployment is moderately higher for unemployed LMI workers but has dropped significantly over the past year.
LMI Job Availability Index
The LMI Job Availability Index surged in the July survey, rising from 116.6 to 130.8 (Chart 3). The index is at its highest level since the survey began in 2009 and is well above neutral. The quarter-over-quarter index also swelled, advancing from 106.6 to 124.9. Expectations about job availability going forward changed little.
Chart 3. LMI Job Availability Index
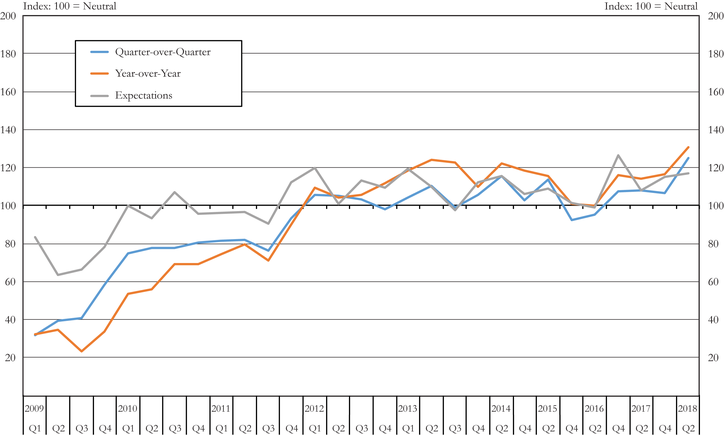
Source: Federal Reserve Bank of Kansas City LMI Survey.
Although the consensus among survey contacts is that there are plenty of jobs available and that the number is increasing, they note that many LMI individuals are unable to participate in the labor market. Among the barriers mentioned, in addition to a lack of adequate child care and transportation, were criminal records, mental health issues, substance abuse and a lack of the basic skills necessary to obtain and retain even a low-skill job. Survey contacts also noted high turnover among LMI workers and reported that many are not staying in jobs long enough to advance and work up to wage increases.
A common comment from survey contacts was that although jobs are available, and indeed, even low-skill jobs remain unfilled, LMI workers are unable to earn a “livable wage” in the jobs that are available. In many cases, the lack of good-paying jobs for LMI workers was attributed to the need for better education and additional training opportunities.
I-C. Housing Affordability
The LMI Housing Affordability Index shifted downward in the July survey from 68.0 to 63.7. The index has slumped since early 2013, due in large part to increasing rents and an insufficient stock of affordable housing. Some survey contacts report construction of affordable housing has continued in some areas, but they often are small projects, like townhomes, and even a growing stock of affordable housing is being outstripped by increasing demand.
While multifamily construction has boomed over the last few years, construction has recently leveled off. Moreover, much of the construction of multifamily homes was in high-end apartments, leaving vacancy rates in lower-priced apartments very low.12 Not only are high rents and lower vacancies making it difficult to find affordable housing, but survey contacts report that some families are being hampered by previous evictions, poor credit and landlords who will not accept housing vouchers.
From a homeownership perspective, low levels of construction coupled with “pent-up demand” for housing from those who want to “move up” to a newly constructed home has put price pressure on existing homes, making them less affordable.13 Households may also be thwarted in their desire to move up to better or larger existing homes, putting price pressure on lower-priced homes and also on rents as fewer rental households are able to move into homeownership. Rising mortgage interest rates, should they continue, would put additional pressure on the affordability of owner-occupied housing.
One way to measure the cost burden of housing is to calculate “housing wages.”14 The housing wage is the wage required to afford a home at Fair Market Rent without being cost-burdened.15 A householder is housing-cost burdened if rent exceeds 30 percent of gross income.
Housing wages can be used to calculate the hours of work required at specific wages to afford a home at the 40th percentile of the rent distribution.16 In Denver, the highest-cost city in the Tenth District, an individual earning minimum wage would need to work 111 hours per week to afford a home at Fair Market Rent without being housing-cost burdened (Chart 4). The minimum wage in Colorado is $10.20/hour. At $15/hour, 76 hours would be required. Even at the median wage (50th percentile of the wage distribution), 54 hours would be required. Thus, one would have to work 54 hours at the 50th percentile wage to afford a home at the 40th percentile. As a caveat, many households have multiple earners, and statutes require higher pay for overtime hours. Still, this analysis makes clear that most homes in Denver are unaffordable to LMI households. A similar story is evident in other larger cities in the District such as Kansas City, Colorado Springs, Oklahoma City, Tulsa, and Omaha (Chart 4).
Chart 4. Required Hours of Work to Afford Fair Market Rent
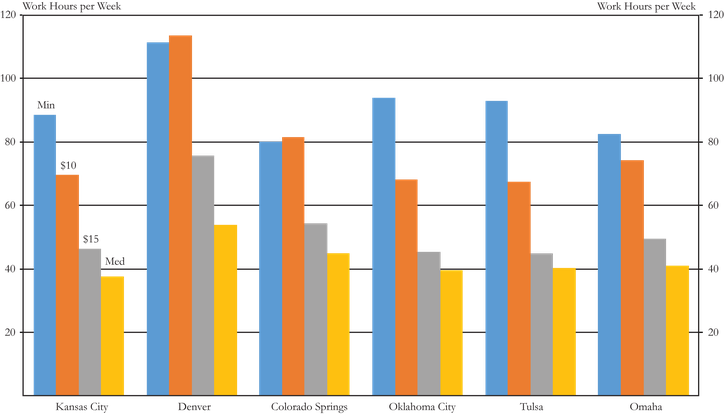
Notes: Required hours to afford Fair Market Rent is calculated by multiplying Fair Market Rent by 12 and then dividing by 0.3 to get the housing wage. The housing wage is multiplied by 40 and divided by the reference wage to get required hours of work (see National Low Income Housing Coalition, “Out of Reach”). Fair Market Rent is $869 in Kansas City, $1,418 in Denver, $851 in Oklahoma City, $842 in Tulsa, and $927 in Omaha. Fair Market Rent is determined by zip code in Colorado Springs. This analysis uses the modal value of $1,020. Housing wages are $17.38 in Kansas City, $28.36 in Denver, $18.15 in Colorado Springs, $17.20 in Oklahoma City, $16.70 in Tulsa, and $18.03 in Omaha. The minimum wage is $7.85 in Missouri, $10.20 in Colorado, $7.25 in Oklahoma, and $9.00 in Nebraska. Median hourly wage is $18.47 in Kansas City, $21.05 in Denver, $18.15 in Colorado Springs, $17.20 in Oklahoma City, $16.70 in Tulsa, and $18.03 in Omaha.
Sources: Federal Reserve Bank of Kansas City; U.S. Department of Labor/HAVER Analytics (for minimum wage); U.S. Bureau of Labor Statistics/HAVER Analytics (for median wage); U.S. Department of Housing and Urban Development (for Fair Market Rents); National Low Income Housing Coalition (for methodology).
I-D. Access to Credit
The LMI Credit Access Index declined modestly in the July survey from 85.6 to 82.5. The index has seen little substantial movement since 2014. Survey respondents again lamented the use of payday lenders and other providers of alternative loan products, although one survey contact suggested that the use is declining. On the other hand, some respondents suggested that LMI individuals and families increasingly are falling victim to scams due to more aggressive marketing. Another issue that arose in survey comments is that with easier credit terms, some LMI individuals and families are taking on additional debt but may not be able to afford it given lackluster increases in incomes. Still, some reported tight credit, especially for mortgages. Some feared that interest rates would rise and increase the debt burden on LMI households.
Summary
The consensus of organizations serving LMI populations is that economic conditions continue to deteriorate in LMI communities, but fewer organizations are reporting so. Job availability is strong, but survey contacts report that wages are too low to support a household and are stagnant—a situation exacerbated by higher prices for items that typically occupy a large share of LMI budgets. Survey contacts continue to report an insufficient supply of affordable housing and that increased demand is outstripping new supply.
II. In This Issue: Income and Health
LMI individuals are less likely to have health insurance compared with high-income people if they are younger than 65 and ineligible for Medicare. Those without health insurance are likely to face higher out-of-pocket cost for medical care, and in some cases, may forgo medical care because of cost. Chart 5 provides data by income group for health insurance coverage (younger than 65) and the share who have avoided seeing a doctor because of cost. The data are from the Centers for Disease Control and Prevention’s Behavioral Risk Factor Surveillance System (BRFSS), which is a nationally representative survey that asks residents about health-related risk factors, chronic health conditions and the use of preventive services.17 The data are from 2016.
Chart 5. Health Insurance Coverage and Lack of Medical Care Due to Cost
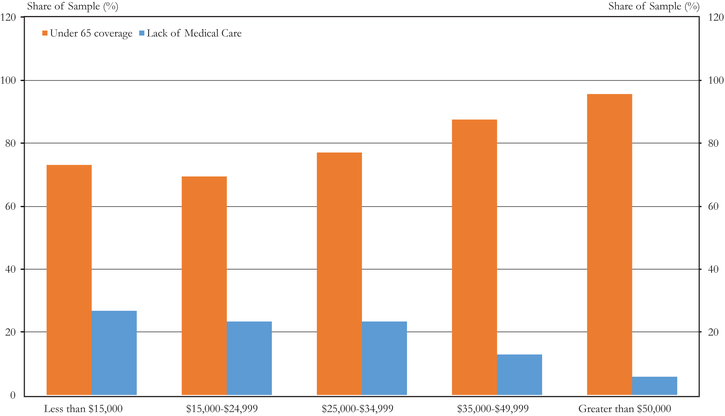
Notes: Data are from the 2016 survey. “Lack of Medical Care” means that at some time during the past year the respondent “needed” to see a doctor but did not because of cost.
Sources: Centers for Disease Control and Prevention, Behavioral Risk Factor Surveillance System.
Except at the lowest levels, insurance coverage increases consistently with income. The share of the population that has forgone medical care because of cost (specifically, “seeing a doctor when they needed to”) decreases consistently with income.
Those with incomes less than $15,000 are slightly more likely to have health insurance (73.2 percent) than those with incomes between $15,000 and $25,000 (69.4 percent), probably because of Medicaid coverage. Only slightly more of those with incomes between $25,000 and $35,000 have health insurance coverage: 77 percent. Almost all of those with incomes more than $50,000 have health insurance coverage (95.7 percent). There are a number of consequences of being uninsured. Uninsured adults have less access to recommended care, receive poorer quality of care and experience worse health outcomes than insured adults.18
Presumably those without insurance are more likely to forgo needed medical care because of cost. Certainly those with lower incomes are more likely to do so. In the BRFSS survey, 26.7 percent of those with incomes less than $15,000 reported that, at some time during the past year, they needed to see a doctor but did not because of cost. About 23 percent of those with incomes between $15,000 and $35,000 chose not to seek care because of cost. By contrast, less than 6 percent of those with incomes more than $50,000 did not see a doctor because of cost.
Unsurprisingly, lower-income people are more likely to self-report specific health problems or overall fair or poor health. These results can be attributed to many factors, such as lack of medical care due to having no insurance, environment, diet and socio-demographic factors, among others. The BRFSS survey asks respondents to rate their general health as excellent, very good, good, fair, or poor. About 30 percent of those with incomes less than $15,000 reported to be in fair or poor health (Chart 6). For those with incomes between $15,000 and $25,000, 21.3 percent reported being in fair or poor health. By comparison, only 5.4 percent of those with incomes more than $50,000 self-reported fair or poor health.
Low-income people are much more likely to have chronic illnesses. According to the BRFSS survey, lower-income people are significantly more likely to report diagnoses of asthma, diabetes and depression (Chart 7). They are no more likely to engage in heavy drinking, which can be a contributor to many illnesses.19 The incidence of asthma, diabetes and depression is more than doubled for those with incomes less than $15,000 compared to those with incomes more than $50,000. The incidence of these diseases decreases consistently as incomes get higher.
Of course, for many, if not most, diabetes, asthma, or depression are not disabling conditions that would prevent them from working, but it is for a significant number of people with these conditions. According to the Social Security Administration, 41 percent of those ages 21-64 with a disability work, compared with 79 percent of that population that does not have a disability.20 The employment rate for those with severe disabilities, defined as those with disabilities covered by Social Security Disability Insurance or Supplemental Security Income, is 7.5 percent.21 Of those claiming a disability, 24.7 percent of those classified with depression or anxiety work, 27.1 percent of those classified with diabetes work and 29.4 percent of those classified with lung or respiratory problems work.22 In general, disabilities are more common among the low-income. In 2016, 17.9 percent of those living in poverty had some kind of disability, compared with 7.7 percent of the general population.23
Summary
Compared to higher-income people, LMI people are much less likely to have health insurance, which can lead to higher out-of-pocket costs, and in turn, a lack of care in some cases. LMI people also are more likely to have chronic illnesses and to self-report fair or poor health. For a significant share, these are disabling conditions that often prevent them from working.
Endnotes
-
1 Inflation data are from the U.S. Bureau of Labor Statistics /HAVER Analytics.
-
2 These are national statistics. Multifamily rent is calculated by the Federal Reserve Bank of Kansas City. Multifamily rents are inferred from several BLS/CPI series. The computation of multifamily rent assumes that owner equivalent rent (OER) is all single family (SF) and that rent of primary residence is ½ of each (based on micro data), implying that (approximately) (0.5)SF growth + (0.5)MF growth = growth in rent of primary residence.
-
3 Data are from the Centers for Disease Control and Prevention’s Behavioral Risk Factor Surveillance System, which is a nationally representative survey. Data reported here are for 2016, which are the latest available.
-
4 Oil prices recently have retreated in the face of unexpectedly large U.S. stockpiles and global tensions. See Dan Molinski and Christopher Alessi, “Oil Plunges on Contagion Fears, Rising Supplies,” The Wall Street Journal, Aug. 15, 2018. Available at External Linkhttps://www.wsj.com/articles/oil-falls-amid-rising-u-s-inventories-1534328181
-
5 Data are from the Establishment Survey, U.S. Bureau of Labor Statistics /HAVER Analytics.
-
6 For additional details on the agriculture sector, see Nathan Kauffman and Ty Kreitman, 2018, “A Dip in the Farm Economy,” Ag Credit Survey, Federal Reserve Bank of Kansas City, Aug. 9.
-
7 These statistics are calculated by the Federal Reserve Bank of Kansas City using microdata from the Current Population Survey.
-
8 For additional data on the Tenth District economy, see Tenth District Economic Databooks.
-
9 This alternative rate should not be confused with U-6, the typically reported alternative unemployment rate that includes all individuals marginally attached to the labor market, of which discouraged workers are a subset.
-
10 Separating unemployment from income is problematic in that employment and income are closely tied and unemployed people generally have lower incomes (although they may receive unearned income, such as unemployment compensation). In discussing labor market metrics for LMI workers, we consider an individual as being LMI if s/he lives in an LMI household. We do not have sufficient data to produce an LMI unemployment rate for the District or individual states.
-
11 See Didem Tüzemen, 2018, “Why Are Prime-Age Men Vanishing from the Labor Force,” Economic Review, Federal Reserve Bank of Kansas City, 103(1), 5-30.
-
12 See Jordan Rappaport, 2018, “Pent-Up Demand and Continuing Price Increases: The Outlook for Housing in 2018,” The Macro Bulletin, Federal Reserve Bank of Kansas City, Jan. 10.
-
13 Id.
-
14 See National Low Income Housing Coalition, “Out of Reach 2018,” available at http://nlihc.org/oor/
-
15 Fair Market Rent is computed by the U.S. Department of Housing and Urban Development primarily to determine payment standard amounts for the Housing Choice Voucher Program (formerly Section 8) and several other assisted housing programs. Typically, it is set at the 40th percentile of the distribution of rents in a particular city.
-
16 The calculation is (housing wage x 40) / actual wage. See chart notes for details.
-
17 The BRFSS is the largest continuously conducted health survey in the world, conducting about 400,000 interviews per year. For more information, see External Linkhttps://www.cdc.gov/brfss/about/index.htm
-
18 See J. Michael McWilliams, 2009, “Health Consequences of Uninsurance Among Adults in the United States: Recent Evidence and Implications,” Millbank Quarterly, 87(2), 443-494 and references therein. Other factors can affect the correlation between uninsurance and health outcomes. The uninsured may differ in sociodemographic factors, environment, and clinical risk factors, among other ways. In addition, poor health may affect the ability to get insurance.
-
19 “Heavy drinking” is determined by BRFSS analysts based on the weekly consumption of alcohol reported by survey participants.
-
20 U.S. Census Bureau, 2012, “Americans with Disabilities: 2010,” July. Available at External Linkhttps://www.census.gov/library/publications/2012/demo/p70-131.html
-
21 Id., Table A-2.
-
22 Id.
-
23 Kelly D. Edmiston, 2018, “Reaching the Hard to Reach with Intermediaries: The Kansas City Fed’s LMI Survey,” Federal Reserve Bank of Kansas City Research Working Paper 18-06, July.
The views expressed are those of the authors and do not necessarily reflect the positions of the Federal Reserve Bank of Kansas City or the Federal Reserve System.