I. General Assessment
Most indicators of economic and financial conditions in low- and moderate-income (LMI) communities have rebounded from the prior survey. But other than the job availability index, the indicators remain below neutral, suggesting that conditions continue to deteriorate. Increased values in the indexes resulted from fewer respondents reporting declining conditions. Most survey indexes are near 2013-14 levels. The indexes, which are diffusion indexes (see box), are computed from responses to the Federal Reserve Bank of Kansas City’s biannual LMI Survey, which was administered in January 2017 (January survey). The survey is biannual, but asks respondents about conditions in the previous quarter and year and seeks projections for the following quarter. LMI individuals, families or households are those with incomes less than 80 percent of area median income. For those in urban areas, area median income is the value for the metropolitan area; for those in rural areas, it is state median income.
Diffusion Indexes
Providers of services to the LMI population respond to each survey question by indicating whether conditions during the current quarter were higher (or better) than, lower (or worse) than, or the same as in the previous quarter (quarterly index) or year (year-over-year index). Providers also are asked about what they expect conditions will be in the next quarter. Diffusion indexes are computed by subtracting the percent of service providers that responded lower (or worse) from the percent that responded higher (or better) and adding 100. The exception is the LMI Services Needs Index, which is computed by subtracting the percent of service providers that responded higher from the percent that responded lower and adding 100 to show that higher needs translate into lower numbers for the index. Any reading below 100 indicates the overall assessment of survey respondents is that conditions are worsening. For example, an increase in the index from 70 to 85 would indicate conditions are still deteriorating, by consensus, but that fewer respondents are reporting worsening conditions. Any value above 100 indicates improving conditions, even if the index has fallen from the previous quarter or year. A value of 100 is neutral.
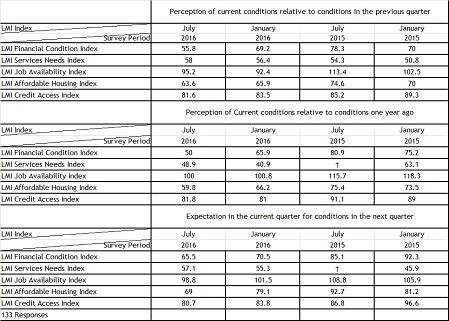
Following a decline from 69.2 to 55.8 in the July 2016 survey (July survey), the LMI Financial Condition Index, the broadest measure of economic conditions in the LMI community, rose to 68.1 in the January survey (Chart 1). Despite reversing course, the index still was well off its previous high of 87.5 in 2013. Almost 40 percent of respondents said LMI financial conditions were worse relative to last quarter. Perceptions of economic conditions relative to a year ago also increased significantly, from 50.0 to 65.1, but likewise failed to recapture the previous high of 82.8 in 2013. Both indexes of financial conditions are well below the neutral reading of 100, indicating a consensus view that economic conditions in the LMI community have deteriorated.
Chart 1: LMI Financial Condition Index
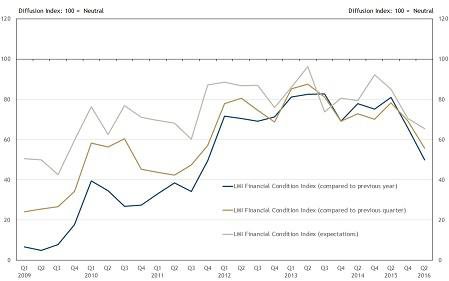
Notes: LMI Survey data were collected quarterly prior to 2014. For details on the computation of diffusion index values, see box inset in the text.
(Source: Federal Reserve Bank of Kansas City LMI Survey)
The upward movement of the LMI Financial Condition Index is broadly consistent with the performance of other indicators, most of which improved significantly, especially year-over-year. Survey comments often tie general economic conditions to job growth, and the indexes typically have moved together over the survey’s history. Indeed, both the LMI Financial Condition Index and the LMI Job Availability Index rebounded strongly in the January survey. Indexes reflecting expectations for the following quarter also mostly improved. In particular, the index reflecting expectations for job availability surged from 98.8 to 126.6, well above neutral. Thus, the consensus of survey responses is that job openings are expected to increase over the next quarter. Indicators have been less steady over the last few quarters, however, and temporary bounces or retreats have been increasingly common. Thus, while most indexes in the January survey increased, more consistent improvement is needed to make a definitive judgment on the direction of LMI economic conditions.
The rest of the report discusses LMI economic conditions in more detail. Section II considers the demand for social and community services, as represented by the LMI Services Needs Index. Section III expands on this discussion with an examination of disability benefits. Section IV highlights the report’s standard labor market metrics. Finally, Section V explores affordable housing issues and access to credit.
II. The Need for Social and Community Services
The LMI Services Needs Index has been relatively flat over the last two years and has remained far below neutral since the survey started in 2009 (Chart 2). At 64.6, the index reached its highest value since 2010 (lower demand for services translates into higher values in the LMI Services Needs Index). Still, 46 percent of respondents reported increased demand for their services. An increase in demand for services is interpreted as deterioration in LMI economic conditions. In most cases, organizations reporting an increase in demand for services attributed the increase to economic conditions, but in some cases demand rose with a broadening scope or promotion of their services.
Chart 2: LMI Services Needs Index
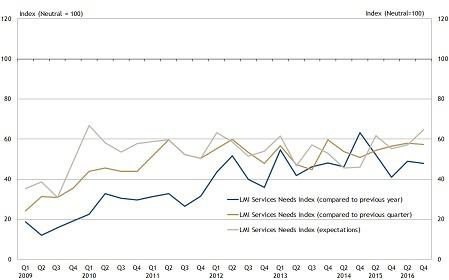
Notes: LMI Survey data were collected quarterly prior to 2014. For details on the computation of diffusion index values, see box inset in the text.
(Source: Federal Reserve Bank of Kansas City LMI Survey)
The year-over-year LMI Services Needs Index (demand relative to one year ago) was little changed, while the index of expectations for the next quarter increased modestly. In the second quarter of 2009, at the trough of the Great Recession, the index was 12.1.
It is important to note that these diffusion indexes, such as the LMI Services Needs Index, are rolling benchmarks. Whether conditions are getting better or worse depends on the value of the index relative to neutral (100). Moreover, neutral does not necessarily imply conditions are perceived as good, only that they are not getting worse.
Many survey respondents expressed concern that state and federal budgets, policies and priorities will change in the near term and perhaps result in lower budgets for their organizations and increased uncertainty about the future. Finally, respondents called for greater collaboration among agencies to work more effectively and efficiently.
External sources we review have reported reduced demand for social and community services and public assistance in recent months, but demand remains historically high. The Supplemental Nutrition Assistance Program (SNAP, formally food stamps) provides funds for low-income individuals to purchase food and is the largest public assistance program for low-income people and families other than Medicaid/CHIP._ There are 44.2 million participants in the SNAP program, or roughly 13.6 percent of the U.S. population. While participation has declined from its 2013 peak of 47.6 million, it remains well above 2007 pre-recession participation of 26.3 million (Chart 3). Temporary Assistance for Needy Families (TANF, formally Aid to Families with Dependent Children), the program typically associated with “welfare,” provides block grants from which states can fund programs and services that aid LMI families with minor children. Participation in TANF increased moderately during the recession, from 1.6 million in 2008 to 1.9 million in 2011, but since has declined to 1.2 million. The increase in TANF caseloads from 2008 to 2011 can be linked to the recession, but the increase was a departure from a secular downward trend.
Chart 3: Participants in the Supplemental Nutrition Assistance Program (SNAP) and Temporary Assistance for Needy Families (TANF)
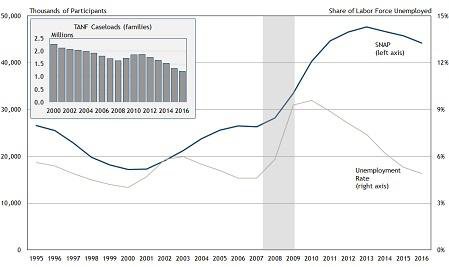
Source: U.S. Department of Agriculture; U.S. Bureau of Labor Statistics; Office of Family Assistance
III. Disability Benefits
The federal government offers cash benefits to assist people with disabilities. The largest of these are Social Security Disability Insurance (SSDI) and Supplemental Security Income (SSI). The SSDI program provides benefits to disabled people who have worked and paid Social Security taxes for a specified time, measured as work credits._ SSI is a needs-based benefit program that is not based on prior work history._ SSI is available to disabled children and adults who have “very limited” resources, currently defined as assets less than $2,000 for an individual or child and $3,000 for a couple.
Because SSDI benefits are provided to former workers, trends in SSDI provide more insight into regional economic strength than trends in SSI. A common feature of extended periods of high and/or increasing unemployment is a concurrent increase in applications for and awards of SSDI benefits. Chart 4 shows SSDI data for the last two decades. There are increases in applications and awards during periods of significantly increasing unemployment._ For example, during the 2007-09 recession and early recovery period, the (seasonally adjusted) national unemployment rate rose from 4.4 percent in June 2007 to 9.9 percent in March 2010._ Over the same period, applications for disability benefits increased 38 percent and approvals rose 30 percent. One explanation for the cyclicality of SSDI benefit data could be that unemployed workers who have exhausted their unemployment insurance benefits might use SSDI as a way to extend their benefits. Recent research, however, has not found such a link between unemployment insurance (UI) and SSDI._
Chart 4: Social Security Disability Benefits Awards and Unemployment Rate
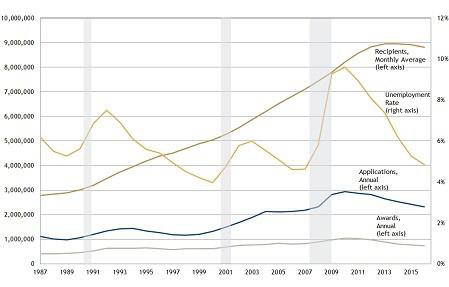
Notes: Shaded areas indicate recessions. The unemployment rate often lags GDP growth, which determines recessions.
Sources: Social Security Administration, U.S. Bureau of Labor Statistics, Haver Analytics
IV. Labor Market Metrics
Job Availability
Perceptions of job availability relative to the previous quarter and previous year increased significantly in the January LMI Survey, as did expectations for the next quarter (Chart 5). The LMI Job Availability Index advanced strongly into positive territory, to 107.4 from 95.2. Thus, the consensus view of survey respondents is that jobs are more widely available for LMI workers. The year-over-year index rose from 100 to 115.8, while the index reflecting expectations for next quarter soared from 98.8 to 126.6, attaining its highest value ever over the eight-year history of the survey. The unemployment rate and other standard measures of labor market conditions also improved. The Kansas City Fed’s Labor Market Conditions Index (LMCI), an amalgam of 24 monthly labor market data series that is independent of the LMI Survey, also has been positive in recent months, meaning labor market conditions generally are above their long-run average._
Chart 5: LMI Job Availability Index
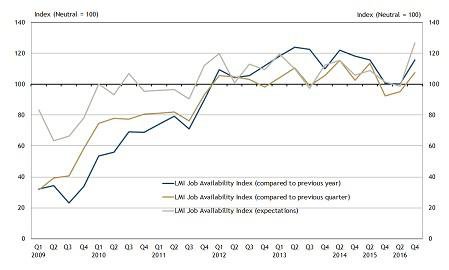
Notes: LMI Survey data were collected quarterly prior to 2014. For details on the computation of diffusion index values, see box inset in the text.
Source: Federal Reserve Bank of Kansas City LMI Survey
Although most survey contacts reported job growth, and some also observed an increase in small businesses, comments suggested that wage growth was weak and insufficient to compensate workers for rising costs of living, particularly housing.
Unemployment Rate
The official U.S. unemployment rate (termed U-3), which is defined as the share of the labor force that is not currently working but has actively sought employment in the last four weeks, was 4.7 percent in December 2016 (seasonally adjusted). The Tenth District unemployment rate was 4.2 percent. By comparison, the December 2015 unemployment rate was 5.0 nationally and 4.1 percent in the District._
The Bureau of Labor Statistics (BLS) reports a number of alternative unemployment rates._ U-6 is the broadest measure of unemployment. It accounts not only for the officially unemployed, but also workers who are part time for economic reasons (discussed below), and workers who are marginally attached to the labor force._The national U-6 unemployment rate for December 2016 was 9.2 percent, down from 9.8 percent in December 2015. The District U-6 unemployment rate was 7.8 percent in December 2016, compared to 7.7 percent in December 2015._
States, and especially localities, such as counties and cities, often have diverse industrial structures, which may make them more or less susceptible to shocks in specific sectors. Natural resources also provide geographic diversity across the District. Assessments of labor market conditions in the January LMI Survey were much more discouraging from respondents who identified their markets as dependent on agriculture or energy.
County unemployment rates in the District ranged from 1.5 percent to 9.3 percent in December 2016. High unemployment was concentrated mostly in New Mexico and southeastern Oklahoma._ However, much of the District is below the national unemployment rate, especially Nebraska, western Kansas and Colorado (Map 1).
Map 1: Unemployment Rate by County, December 2016
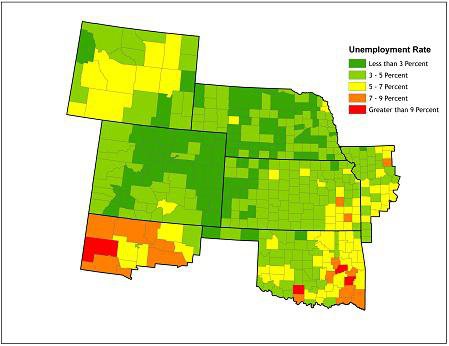
Source: U.S. Bureau of Labor Statistics, Haver Analytics
Duration of Unemployment
A significant labor market problem during the recession and recovery has been the rate of long-term unemployment, which is the share of unemployed who have been out of work for more than 26 weeks. The long-term unemployed share of total unemployment in December 2016 was 24.2 percent. The share has declined sharply since its peak of 45.5 percent in April 2010, but remains high by historical standards. From the post-World War II era to the 2007-09 recession, the long-term unemployed share of total unemployment topped 25 percent only in June 1983. Although recessions typically are associated with much higher shares of long-term unemployment, they have peaked between 20 percent and 25 percent. In non-recession years between 1970 and 2007, the share of long-term unemployment averaged 10.3 percent. The share of long-term unemployed exceeded 25 percent from April 2009 to November 2016.
Labor Force Participation
The labor force participation rate (LFPR) is the share of the population eligible to work (noninstitutionalized population 16 years and older) that is employed or not employed but actively seeking employment (searched in the last four weeks). In December 2016, the national LFPR was 62.7 percent, which was unchanged from December 2015 and still well below its average pre-recession level of about 66 percent.
For the majority of people not in the labor force, the decision is by choice. 94 percent report that they are not seeking employment, a significant portion of whom are voluntarily retired. But for others, lack of labor force participation is not entirely “voluntary.” In particular, some are “discouraged workers,” who no longer are actively seeking employment because they believe such a search would be futile. In December 2016, there were about 426,000 discouraged workers, accounting for 0.4 percent of work-eligible individuals not in the labor force.
Underemployment
Challenges to the LMI labor market extend beyond unemployment to “underemployment,” typically defined as an insufficient amount of work, but often more broadly defined to include those working in an occupation that requires education, training and/or experience below those attained by the worker.
Among the employed, millions are part-time workers who would prefer a full-time job. The BLS defines part-time employment as less than 35 hours a week. Most workers who are employed part time have sought part-time work intentionally. They may want to work only part time to devote more time to family or other pursuits, or they simply may be uninterested in working full time. Many are part time for economic reasons, however, such as a lack of opportunity for full-time work and slack business conditions.
The percentage of employees working part time for economic reasons in the Tenth District is roughly the same as in the nation as a whole. The fraction of employed workers employed part time for economic reasons was 3.6 percent nationally in December 2016, compared to 3.5 percent in the District. For workers in the LMI community, reluctant part-timers make up 5.9 percent of the employed population in the United States and 5.2 percent in the Tenth District._
V. Affordable Housing and Access to Credit
The LMI Affordable Housing Index rose from 63.6 in the July LMI Survey to 77.8 in the January survey (Chart 6). The quarter-ahead outlook and year-over-year indexes also increased. The year-over-year index surged from 59.8 to 81.2, returning to 2014 levels. While the bounce-back in the year-over-year affordable housing index is encouraging, the strong showing in the January survey itself is not sufficient to identify a trend. Further, the index remains significantly below neutral, which indicates continued deterioration in affordable housing. Multiple contacts reported that the current stock of affordable housing remains well below the level required to meet current needs.
Many comments from the January survey lamented increasing market-rate rents, which have increased the demand for affordable housing units._ Some contacts also expressed concerns that affordable housing units in their area are nearing their required tenure as affordable housing and may soon transition into market-rate units.
Indicators of access to credit (perception relative to the previous quarter and year and expectations for the following quarter) continued to fluctuate in the January survey but still indicated deteriorating conditions. The LMI Credit Access Index fell from 81.6 to 79.5 for the quarter, while the year-to-year index remained at 81.8. The index for the upcoming quarter increased moderately. The indexes increased significantly and consistently from the start of the survey in the first quarter of 2009 through 2013, but have fluctuated since around 80. Respondents noted debt, bank closures and tightened restrictions on bank credit as issues affecting access to credit access.
Chart 6: LMI Affordable Housing Index
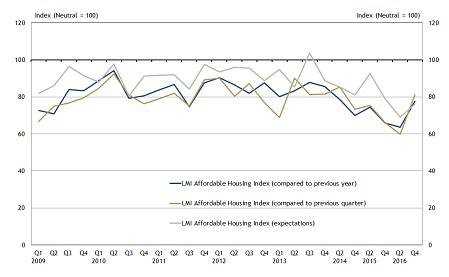
Notes: LMI Survey data were collected quarterly prior to 2014. For details on the computation of diffusion index values, see box inset in the text.
Source: Federal Reserve Bank of Kansas City LMI Survey
This report is a consolidation of two former publications: the LMI Survey and the Tenth District LMI Labor Force Report. Each issue continues to report results from the LMI Survey, and additional sections analyze external data relevant to LMI communities. In addition, special topics that relate to the LMI community are covered in each issue. A list of special topics covered in previous issues is available below. Past issues of the LMI Survey and the Tenth District LMI Labor Force Report are available on the Kansas City Fed’s community development research website.
Note: Results from the LMI Organizational Funding Index and LMI Organizational Capacity Index will be discussed in a future Community Connections article.
Special Topics in Tenth District LMI Economic Conditions
March 23, 2017
Disability Benefits
October 12, 2016
Demand for Services Relative to Funding; Minority Unemployment Gaps, Labor Force Participation Rates and Affordable Housing
March 3, 2016
Rent Growth and Affordable Housing
August 18, 2015
Wage Growth for LMI Workers and Rental Housing Affordability
Appendix: Diffusion Indexes For Low-and Moderate Income Survey Responses
Endnotes
Endnotes
-
1 The Children’s Health Insurance Program (CHIP) is administered with the Medicaid program. In November 2016, 68.9 million individuals were enrolled in Medicaid and 5.5 million were enrolled in CHIP. For additional data and details, see External Linkhttp://www.medicaid.gov. About 23 percent of the U.S. population is enrolled in Medicaid/CHIP.
-
2 Details about the SSDI program, including the role of prior work history in determining eligibility and benefit levels, is available in the pamphlet “Disability Benefits,” published by the Social Security Administration. The pamphlet is available at External Linkhttp://www.ssa.gov/pubs/EN-05-10029.pdf. See also “How You Earn Credits,” available at External Linkhttp://www.ssa.gov/pubs/EN-05-10072.pdf. Eligibility for Social Security retirement benefits (OASDI) also is determined by work credits.
-
3 SSI is financed by general funds, not by Social Security taxes, although it is managed by the Social Security Administration.
-
4 All of these periods of increasing unemployment are associated with recessions, and recoveries from these most recent recessions are commonly described as “jobless recoveries.” For more information, see Natalia A. Kolesnikova and Yang Liu, “Jobless Recoveries: Causes and Consequences,” The Regional Economist, Federal Reserve Bank of St. Louis, April 2011. Available at External Linkhttps://www.stlouisfed.org/Publications/Regional-Economist/April-2011/Jobless-Recoveries-Causes-and-Consequences.
-
5 These data are from the U.S. Bureau of Labor Statistics and were seasonally adjusted using Haver Analytics DLXVG3.
-
6 Andreas I. Mueller, Jesse Rothstein and Till M. von Wachter, “Unemployment Insurance and Disability Insurance in the Great Recession,” National Bureau of Economic Research Working Paper No. 19672, September, 2012. Available at External Linkhttp://www.nber.org/papers/w19672. The counter cyclicality instead may be the result of the influence poor economic conditions may have on the Social Security Administration’s perception of an applicant’s employability. This possibility, however, would not explain the increase in applications unless the rate of applications was very closely tied to the probability that applications are accepted. Moreover, while there is counter cyclicality in applications and awards, average monthly beneficiaries have increased at a fairly consistent rate with little obvious departure from its secular trend. More research is needed to fully uncover the relationship between unemployment and applications and awards for SSDI.
-
7 See Labor Market Conditions Indicators at External Linkhttps://www.kansascityfed.org/research/indicatorsdata/lmci.
-
8 Historical unemployment rates for the Tenth District and District states are available in the Kansas City Fed’s “Tenth District Economic Databooks.".
-
9 See U.S. Bureau of Labor Statistics, Employment Situation, Table A-15, “Alternative Measures of Labor Underutilization.” Available at External Linkhttp://www.bls.gov/news.release/empsit.t15.htm.
-
10 Tenth District Economic DatabooksA person who is marginally attached to the labor force in one who is not in the labor force, as defined by the BLS, but wants and is available for work and has looked for a job in the last 12 months. An important segment of the marginally attached is “discouraged workers,” who have stopped looking for work because they believe a continued search would be futile. Other forms of marginal attachment would include, for example, temporarily halting a job search to gain a new skill. The key is that the individual has looked for work in the last 12 months but not in the past four weeks and wants a job.
-
11 Estimated using microdata from the December 2016 Current Population Survey administered by the U.S. Census Bureau. See External Linkhttp://www.census.gov/programs-surveys/cps.html.
-
12 See Federal Reserve Bank of Kansas City, “Tenth District Economic Databooks.”. See also the Kansas City Fed’s “Energy Survey."
-
13 PS microdata were used to compute involuntary rates of part-time work for the District. Here the term “LMI worker” is used broadly to consist of workers in LMI families or those who live in LMI communities, as determined by CPS microdata.
-
14 Recent Kansas City Fed research suggests that while rents have increased in most metropolitan areas, affordability, as measured by rent relative to income, has not. Still, workers at fixed wages, such as the federal minimum wage of $7.25, likely would find rent increases burdensome wherever they might occur. Nationally, households with combined full-time wages below $20/hour face housing costs in excess of 30 percent of income, and therefore are considered to be cost-burdened. See Kelly D. Edmiston, “Residential Rent Affordability Across U.S. Metropolitan Areas,” Economic Review, Federal Reserve Bank of Kansas City, December 2016. Available at https://www.kansascityfed.org/~/media/files/publicat/econrev/econrevarchive/2016/4q16edmiston.pdf.
The views expressed are those of the authors and do not necessarily reflect the positions of the Federal Reserve Bank of Kansas City or the Federal Reserve System.